Jordanian vs Yugoslavian Currently Married
COMPARE
Jordanian
Yugoslavian
Currently Married
Currently Married Comparison
Jordanians
Yugoslavians
48.0%
CURRENTLY MARRIED
96.2/ 100
METRIC RATING
87th/ 347
METRIC RANK
47.2%
CURRENTLY MARRIED
77.4/ 100
METRIC RATING
139th/ 347
METRIC RANK
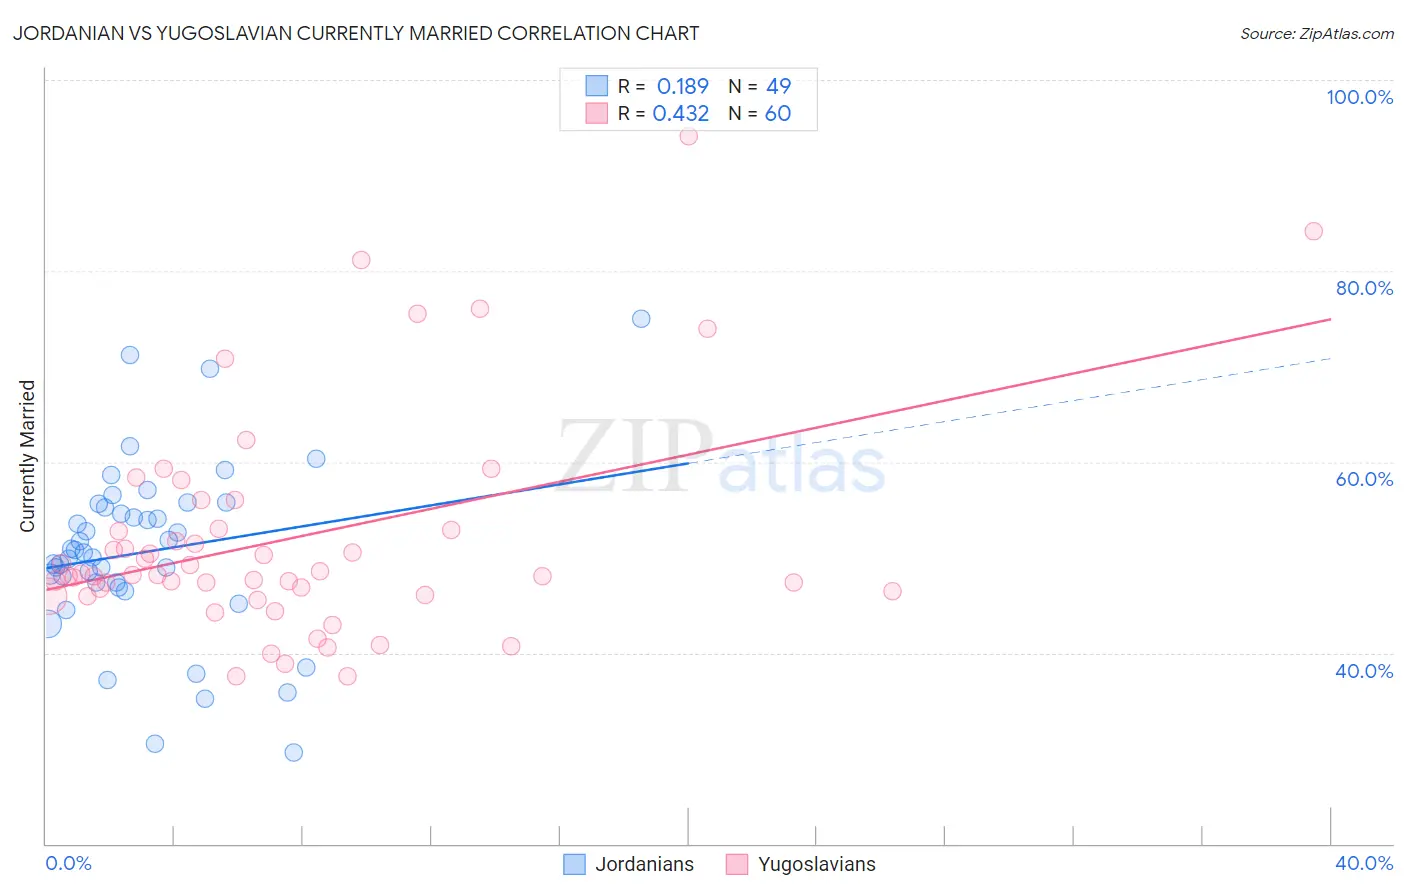
Jordanian vs Yugoslavian Currently Married Correlation Chart
The statistical analysis conducted on geographies consisting of 166,415,795 people shows a poor positive correlation between the proportion of Jordanians and percentage of population currently married in the United States with a correlation coefficient (R) of 0.189 and weighted average of 48.0%. Similarly, the statistical analysis conducted on geographies consisting of 285,712,182 people shows a moderate positive correlation between the proportion of Yugoslavians and percentage of population currently married in the United States with a correlation coefficient (R) of 0.432 and weighted average of 47.2%, a difference of 1.8%.
Currently Married Correlation Summary
| Measurement | Jordanian | Yugoslavian |
| Minimum | 29.6% | 37.5% |
| Maximum | 75.0% | 94.1% |
| Range | 45.4% | 56.6% |
| Mean | 50.6% | 52.0% |
| Median | 50.5% | 48.2% |
| Interquartile 25% (IQ1) | 47.1% | 46.2% |
| Interquartile 75% (IQ3) | 55.4% | 52.9% |
| Interquartile Range (IQR) | 8.3% | 6.7% |
| Standard Deviation (Sample) | 9.1% | 11.6% |
| Standard Deviation (Population) | 9.0% | 11.5% |
Similar Demographics by Currently Married
Demographics Similar to Jordanians by Currently Married
In terms of currently married, the demographic groups most similar to Jordanians are Immigrants from Japan (48.0%, a difference of 0.010%), Immigrants from Eastern Europe (48.0%, a difference of 0.020%), French Canadian (48.0%, a difference of 0.040%), Indian (Asian) (48.0%, a difference of 0.080%), and American (48.0%, a difference of 0.10%).
| Demographics | Rating | Rank | Currently Married |
| Immigrants | Poland | 96.9 /100 | #80 | Exceptional 48.1% |
| Immigrants | Sri Lanka | 96.9 /100 | #81 | Exceptional 48.1% |
| Immigrants | Europe | 96.9 /100 | #82 | Exceptional 48.1% |
| Bolivians | 96.9 /100 | #83 | Exceptional 48.1% |
| Immigrants | Israel | 96.9 /100 | #84 | Exceptional 48.1% |
| French Canadians | 96.3 /100 | #85 | Exceptional 48.0% |
| Immigrants | Japan | 96.2 /100 | #86 | Exceptional 48.0% |
| Jordanians | 96.2 /100 | #87 | Exceptional 48.0% |
| Immigrants | Eastern Europe | 96.1 /100 | #88 | Exceptional 48.0% |
| Indians (Asian) | 95.8 /100 | #89 | Exceptional 48.0% |
| Americans | 95.7 /100 | #90 | Exceptional 48.0% |
| Immigrants | Bolivia | 95.6 /100 | #91 | Exceptional 47.9% |
| Koreans | 95.4 /100 | #92 | Exceptional 47.9% |
| Lebanese | 95.1 /100 | #93 | Exceptional 47.9% |
| Native Hawaiians | 95.0 /100 | #94 | Exceptional 47.9% |
Demographics Similar to Yugoslavians by Currently Married
In terms of currently married, the demographic groups most similar to Yugoslavians are Pakistani (47.2%, a difference of 0.0%), Paraguayan (47.2%, a difference of 0.020%), Immigrants from Vietnam (47.2%, a difference of 0.040%), Cajun (47.1%, a difference of 0.11%), and Immigrants from Norway (47.2%, a difference of 0.12%).
| Demographics | Rating | Rank | Currently Married |
| Afghans | 81.8 /100 | #132 | Excellent 47.3% |
| Immigrants | Malaysia | 81.1 /100 | #133 | Excellent 47.3% |
| Immigrants | Australia | 81.1 /100 | #134 | Excellent 47.3% |
| Immigrants | Norway | 79.7 /100 | #135 | Good 47.2% |
| Immigrants | Vietnam | 78.2 /100 | #136 | Good 47.2% |
| Paraguayans | 77.8 /100 | #137 | Good 47.2% |
| Pakistanis | 77.5 /100 | #138 | Good 47.2% |
| Yugoslavians | 77.4 /100 | #139 | Good 47.2% |
| Cajuns | 75.3 /100 | #140 | Good 47.1% |
| Venezuelans | 74.4 /100 | #141 | Good 47.1% |
| Argentineans | 74.4 /100 | #142 | Good 47.1% |
| Guamanians/Chamorros | 74.2 /100 | #143 | Good 47.1% |
| Hmong | 73.4 /100 | #144 | Good 47.1% |
| Immigrants | South Eastern Asia | 72.9 /100 | #145 | Good 47.1% |
| Carpatho Rusyns | 72.6 /100 | #146 | Good 47.0% |