Black/African American vs Yugoslavian Currently Married
COMPARE
Black/African American
Yugoslavian
Currently Married
Currently Married Comparison
Blacks/African Americans
Yugoslavians
39.6%
CURRENTLY MARRIED
0.0/ 100
METRIC RATING
337th/ 347
METRIC RANK
47.2%
CURRENTLY MARRIED
77.4/ 100
METRIC RATING
139th/ 347
METRIC RANK
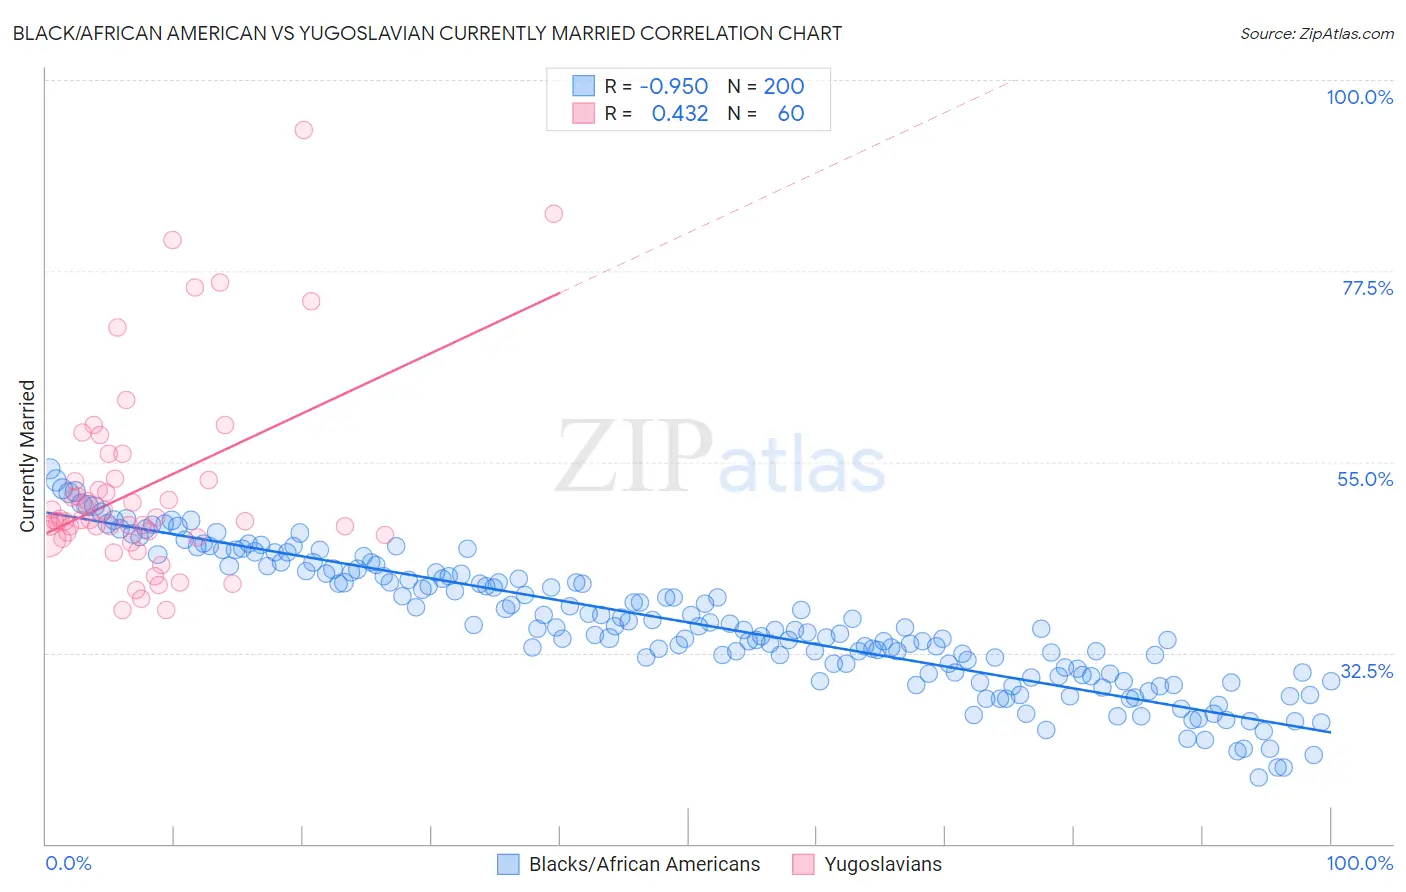
Black/African American vs Yugoslavian Currently Married Correlation Chart
The statistical analysis conducted on geographies consisting of 565,898,128 people shows a near-perfect negative correlation between the proportion of Blacks/African Americans and percentage of population currently married in the United States with a correlation coefficient (R) of -0.950 and weighted average of 39.6%. Similarly, the statistical analysis conducted on geographies consisting of 285,712,182 people shows a moderate positive correlation between the proportion of Yugoslavians and percentage of population currently married in the United States with a correlation coefficient (R) of 0.432 and weighted average of 47.2%, a difference of 19.0%.
Currently Married Correlation Summary
| Measurement | Black/African American | Yugoslavian |
| Minimum | 17.8% | 37.5% |
| Maximum | 54.2% | 94.1% |
| Range | 36.4% | 56.6% |
| Mean | 36.1% | 52.0% |
| Median | 35.4% | 48.2% |
| Interquartile 25% (IQ1) | 30.1% | 46.2% |
| Interquartile 75% (IQ3) | 42.1% | 52.9% |
| Interquartile Range (IQR) | 12.0% | 6.7% |
| Standard Deviation (Sample) | 7.9% | 11.6% |
| Standard Deviation (Population) | 7.9% | 11.5% |
Similar Demographics by Currently Married
Demographics Similar to Blacks/African Americans by Currently Married
In terms of currently married, the demographic groups most similar to Blacks/African Americans are Cape Verdean (39.6%, a difference of 0.090%), Dominican (39.5%, a difference of 0.25%), British West Indian (39.8%, a difference of 0.38%), Lumbee (39.8%, a difference of 0.56%), and Puerto Rican (39.9%, a difference of 0.72%).
| Demographics | Rating | Rank | Currently Married |
| Immigrants | Dominica | 0.0 /100 | #330 | Tragic 40.3% |
| Immigrants | Barbados | 0.0 /100 | #331 | Tragic 40.3% |
| Immigrants | St. Vincent and the Grenadines | 0.0 /100 | #332 | Tragic 40.1% |
| Yup'ik | 0.0 /100 | #333 | Tragic 39.9% |
| Puerto Ricans | 0.0 /100 | #334 | Tragic 39.9% |
| Lumbee | 0.0 /100 | #335 | Tragic 39.8% |
| British West Indians | 0.0 /100 | #336 | Tragic 39.8% |
| Blacks/African Americans | 0.0 /100 | #337 | Tragic 39.6% |
| Cape Verdeans | 0.0 /100 | #338 | Tragic 39.6% |
| Dominicans | 0.0 /100 | #339 | Tragic 39.5% |
| Immigrants | Grenada | 0.0 /100 | #340 | Tragic 39.1% |
| Navajo | 0.0 /100 | #341 | Tragic 39.0% |
| Immigrants | Dominican Republic | 0.0 /100 | #342 | Tragic 38.9% |
| Pueblo | 0.0 /100 | #343 | Tragic 38.2% |
| Immigrants | Cabo Verde | 0.0 /100 | #344 | Tragic 37.8% |
Demographics Similar to Yugoslavians by Currently Married
In terms of currently married, the demographic groups most similar to Yugoslavians are Pakistani (47.2%, a difference of 0.0%), Paraguayan (47.2%, a difference of 0.020%), Immigrants from Vietnam (47.2%, a difference of 0.040%), Cajun (47.1%, a difference of 0.11%), and Immigrants from Norway (47.2%, a difference of 0.12%).
| Demographics | Rating | Rank | Currently Married |
| Afghans | 81.8 /100 | #132 | Excellent 47.3% |
| Immigrants | Malaysia | 81.1 /100 | #133 | Excellent 47.3% |
| Immigrants | Australia | 81.1 /100 | #134 | Excellent 47.3% |
| Immigrants | Norway | 79.7 /100 | #135 | Good 47.2% |
| Immigrants | Vietnam | 78.2 /100 | #136 | Good 47.2% |
| Paraguayans | 77.8 /100 | #137 | Good 47.2% |
| Pakistanis | 77.5 /100 | #138 | Good 47.2% |
| Yugoslavians | 77.4 /100 | #139 | Good 47.2% |
| Cajuns | 75.3 /100 | #140 | Good 47.1% |
| Venezuelans | 74.4 /100 | #141 | Good 47.1% |
| Argentineans | 74.4 /100 | #142 | Good 47.1% |
| Guamanians/Chamorros | 74.2 /100 | #143 | Good 47.1% |
| Hmong | 73.4 /100 | #144 | Good 47.1% |
| Immigrants | South Eastern Asia | 72.9 /100 | #145 | Good 47.1% |
| Carpatho Rusyns | 72.6 /100 | #146 | Good 47.0% |