Immigrants from Dominican Republic vs Yugoslavian Currently Married
COMPARE
Immigrants from Dominican Republic
Yugoslavian
Currently Married
Currently Married Comparison
Immigrants from Dominican Republic
Yugoslavians
38.9%
CURRENTLY MARRIED
0.0/ 100
METRIC RATING
342nd/ 347
METRIC RANK
47.2%
CURRENTLY MARRIED
77.4/ 100
METRIC RATING
139th/ 347
METRIC RANK
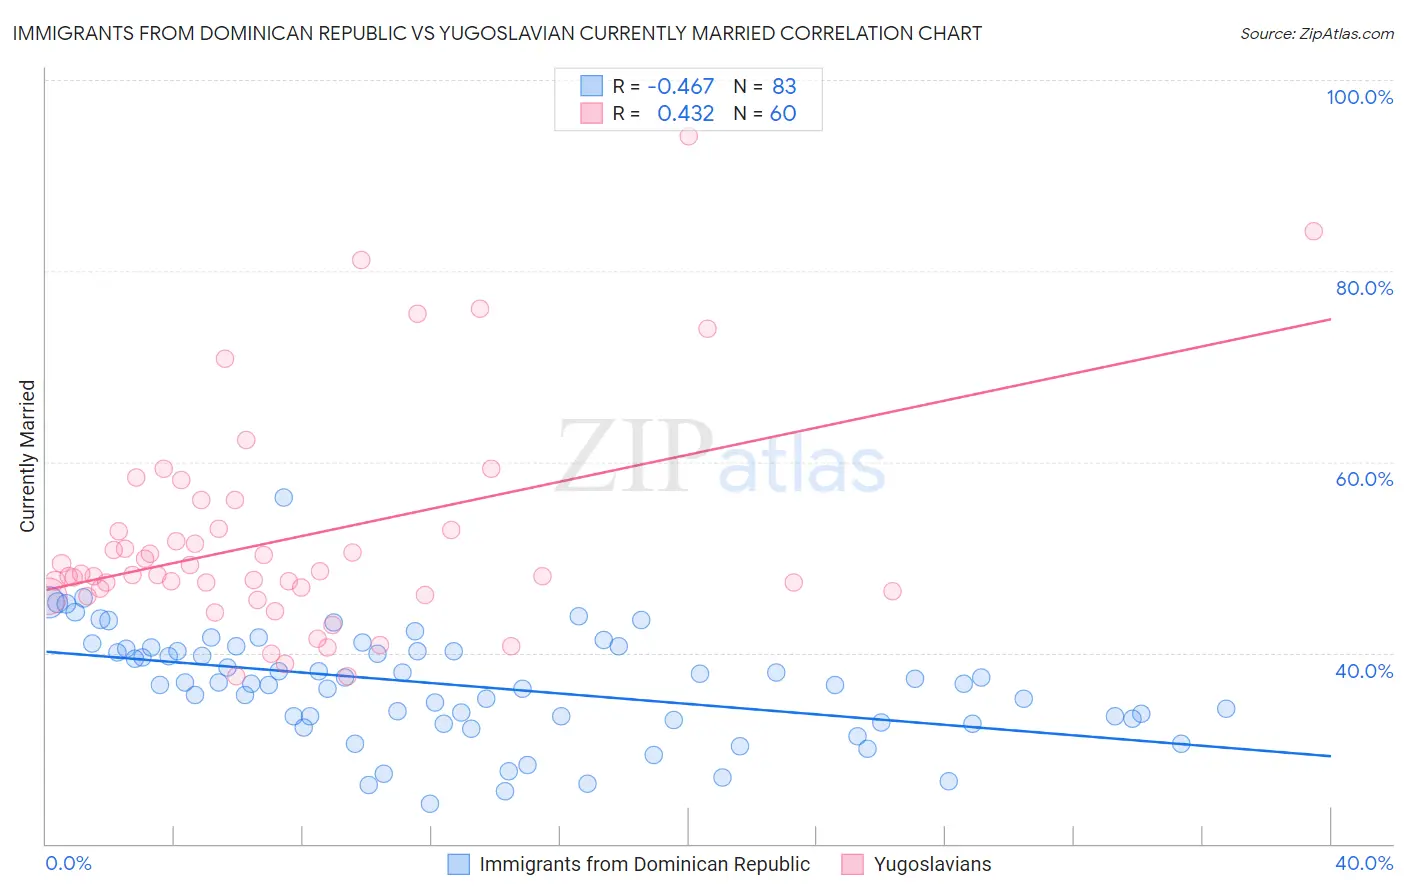
Immigrants from Dominican Republic vs Yugoslavian Currently Married Correlation Chart
The statistical analysis conducted on geographies consisting of 275,115,550 people shows a moderate negative correlation between the proportion of Immigrants from Dominican Republic and percentage of population currently married in the United States with a correlation coefficient (R) of -0.467 and weighted average of 38.9%. Similarly, the statistical analysis conducted on geographies consisting of 285,712,182 people shows a moderate positive correlation between the proportion of Yugoslavians and percentage of population currently married in the United States with a correlation coefficient (R) of 0.432 and weighted average of 47.2%, a difference of 21.1%.
Currently Married Correlation Summary
| Measurement | Immigrants from Dominican Republic | Yugoslavian |
| Minimum | 24.2% | 37.5% |
| Maximum | 56.2% | 94.1% |
| Range | 32.0% | 56.6% |
| Mean | 36.5% | 52.0% |
| Median | 36.8% | 48.2% |
| Interquartile 25% (IQ1) | 33.0% | 46.2% |
| Interquartile 75% (IQ3) | 40.5% | 52.9% |
| Interquartile Range (IQR) | 7.4% | 6.7% |
| Standard Deviation (Sample) | 5.7% | 11.6% |
| Standard Deviation (Population) | 5.7% | 11.5% |
Similar Demographics by Currently Married
Demographics Similar to Immigrants from Dominican Republic by Currently Married
In terms of currently married, the demographic groups most similar to Immigrants from Dominican Republic are Navajo (39.0%, a difference of 0.17%), Immigrants from Grenada (39.1%, a difference of 0.52%), Dominican (39.5%, a difference of 1.5%), Cape Verdean (39.6%, a difference of 1.6%), and Black/African American (39.6%, a difference of 1.7%).
| Demographics | Rating | Rank | Currently Married |
| Yup'ik | 0.0 /100 | #333 | Tragic 39.9% |
| Puerto Ricans | 0.0 /100 | #334 | Tragic 39.9% |
| Lumbee | 0.0 /100 | #335 | Tragic 39.8% |
| British West Indians | 0.0 /100 | #336 | Tragic 39.8% |
| Blacks/African Americans | 0.0 /100 | #337 | Tragic 39.6% |
| Cape Verdeans | 0.0 /100 | #338 | Tragic 39.6% |
| Dominicans | 0.0 /100 | #339 | Tragic 39.5% |
| Immigrants | Grenada | 0.0 /100 | #340 | Tragic 39.1% |
| Navajo | 0.0 /100 | #341 | Tragic 39.0% |
| Immigrants | Dominican Republic | 0.0 /100 | #342 | Tragic 38.9% |
| Pueblo | 0.0 /100 | #343 | Tragic 38.2% |
| Immigrants | Cabo Verde | 0.0 /100 | #344 | Tragic 37.8% |
| Tohono O'odham | 0.0 /100 | #345 | Tragic 36.8% |
| Hopi | 0.0 /100 | #346 | Tragic 36.5% |
| Pima | 0.0 /100 | #347 | Tragic 35.9% |
Demographics Similar to Yugoslavians by Currently Married
In terms of currently married, the demographic groups most similar to Yugoslavians are Pakistani (47.2%, a difference of 0.0%), Paraguayan (47.2%, a difference of 0.020%), Immigrants from Vietnam (47.2%, a difference of 0.040%), Cajun (47.1%, a difference of 0.11%), and Immigrants from Norway (47.2%, a difference of 0.12%).
| Demographics | Rating | Rank | Currently Married |
| Afghans | 81.8 /100 | #132 | Excellent 47.3% |
| Immigrants | Malaysia | 81.1 /100 | #133 | Excellent 47.3% |
| Immigrants | Australia | 81.1 /100 | #134 | Excellent 47.3% |
| Immigrants | Norway | 79.7 /100 | #135 | Good 47.2% |
| Immigrants | Vietnam | 78.2 /100 | #136 | Good 47.2% |
| Paraguayans | 77.8 /100 | #137 | Good 47.2% |
| Pakistanis | 77.5 /100 | #138 | Good 47.2% |
| Yugoslavians | 77.4 /100 | #139 | Good 47.2% |
| Cajuns | 75.3 /100 | #140 | Good 47.1% |
| Venezuelans | 74.4 /100 | #141 | Good 47.1% |
| Argentineans | 74.4 /100 | #142 | Good 47.1% |
| Guamanians/Chamorros | 74.2 /100 | #143 | Good 47.1% |
| Hmong | 73.4 /100 | #144 | Good 47.1% |
| Immigrants | South Eastern Asia | 72.9 /100 | #145 | Good 47.1% |
| Carpatho Rusyns | 72.6 /100 | #146 | Good 47.0% |