Jordanian vs Japanese Currently Married
COMPARE
Jordanian
Japanese
Currently Married
Currently Married Comparison
Jordanians
Japanese
48.0%
CURRENTLY MARRIED
96.2/ 100
METRIC RATING
87th/ 347
METRIC RANK
44.5%
CURRENTLY MARRIED
0.6/ 100
METRIC RATING
244th/ 347
METRIC RANK
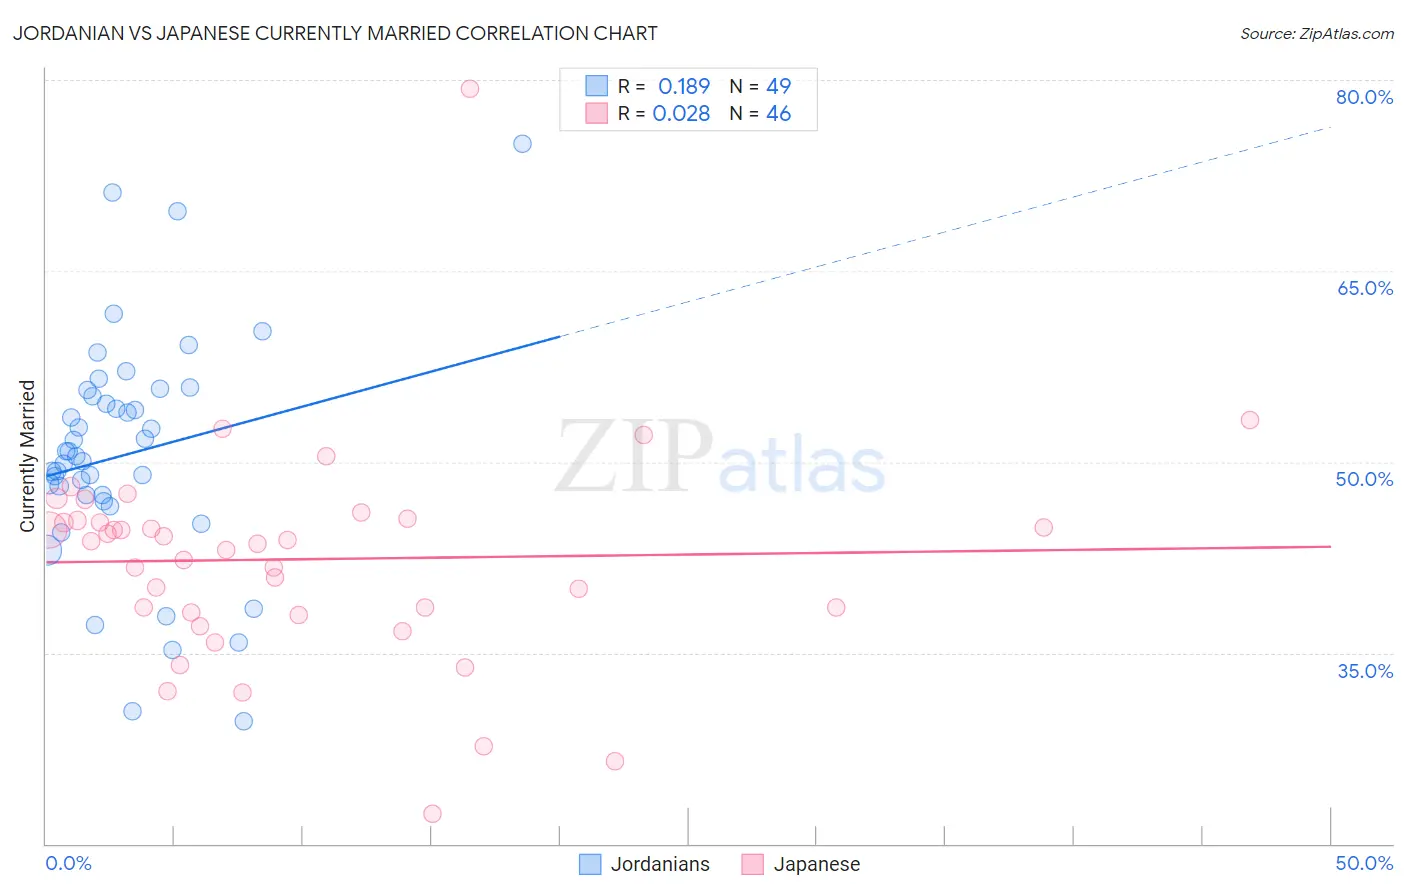
Jordanian vs Japanese Currently Married Correlation Chart
The statistical analysis conducted on geographies consisting of 166,415,795 people shows a poor positive correlation between the proportion of Jordanians and percentage of population currently married in the United States with a correlation coefficient (R) of 0.189 and weighted average of 48.0%. Similarly, the statistical analysis conducted on geographies consisting of 249,168,550 people shows no correlation between the proportion of Japanese and percentage of population currently married in the United States with a correlation coefficient (R) of 0.028 and weighted average of 44.5%, a difference of 8.0%.
Currently Married Correlation Summary
| Measurement | Jordanian | Japanese |
| Minimum | 29.6% | 22.4% |
| Maximum | 75.0% | 79.3% |
| Range | 45.4% | 56.9% |
| Mean | 50.6% | 42.3% |
| Median | 50.5% | 43.7% |
| Interquartile 25% (IQ1) | 47.1% | 38.2% |
| Interquartile 75% (IQ3) | 55.4% | 45.4% |
| Interquartile Range (IQR) | 8.3% | 7.2% |
| Standard Deviation (Sample) | 9.1% | 8.6% |
| Standard Deviation (Population) | 9.0% | 8.6% |
Similar Demographics by Currently Married
Demographics Similar to Jordanians by Currently Married
In terms of currently married, the demographic groups most similar to Jordanians are Immigrants from Japan (48.0%, a difference of 0.010%), Immigrants from Eastern Europe (48.0%, a difference of 0.020%), French Canadian (48.0%, a difference of 0.040%), Indian (Asian) (48.0%, a difference of 0.080%), and American (48.0%, a difference of 0.10%).
| Demographics | Rating | Rank | Currently Married |
| Immigrants | Poland | 96.9 /100 | #80 | Exceptional 48.1% |
| Immigrants | Sri Lanka | 96.9 /100 | #81 | Exceptional 48.1% |
| Immigrants | Europe | 96.9 /100 | #82 | Exceptional 48.1% |
| Bolivians | 96.9 /100 | #83 | Exceptional 48.1% |
| Immigrants | Israel | 96.9 /100 | #84 | Exceptional 48.1% |
| French Canadians | 96.3 /100 | #85 | Exceptional 48.0% |
| Immigrants | Japan | 96.2 /100 | #86 | Exceptional 48.0% |
| Jordanians | 96.2 /100 | #87 | Exceptional 48.0% |
| Immigrants | Eastern Europe | 96.1 /100 | #88 | Exceptional 48.0% |
| Indians (Asian) | 95.8 /100 | #89 | Exceptional 48.0% |
| Americans | 95.7 /100 | #90 | Exceptional 48.0% |
| Immigrants | Bolivia | 95.6 /100 | #91 | Exceptional 47.9% |
| Koreans | 95.4 /100 | #92 | Exceptional 47.9% |
| Lebanese | 95.1 /100 | #93 | Exceptional 47.9% |
| Native Hawaiians | 95.0 /100 | #94 | Exceptional 47.9% |
Demographics Similar to Japanese by Currently Married
In terms of currently married, the demographic groups most similar to Japanese are Immigrants from Ethiopia (44.5%, a difference of 0.070%), Immigrants from Cambodia (44.5%, a difference of 0.090%), Ethiopian (44.5%, a difference of 0.12%), Immigrants from Mexico (44.5%, a difference of 0.18%), and Mexican American Indian (44.5%, a difference of 0.18%).
| Demographics | Rating | Rank | Currently Married |
| Seminole | 0.9 /100 | #237 | Tragic 44.6% |
| Moroccans | 0.9 /100 | #238 | Tragic 44.6% |
| Immigrants | Mexico | 0.7 /100 | #239 | Tragic 44.5% |
| Mexican American Indians | 0.7 /100 | #240 | Tragic 44.5% |
| Ethiopians | 0.7 /100 | #241 | Tragic 44.5% |
| Immigrants | Cambodia | 0.7 /100 | #242 | Tragic 44.5% |
| Immigrants | Ethiopia | 0.7 /100 | #243 | Tragic 44.5% |
| Japanese | 0.6 /100 | #244 | Tragic 44.5% |
| Immigrants | Armenia | 0.4 /100 | #245 | Tragic 44.3% |
| Immigrants | Burma/Myanmar | 0.4 /100 | #246 | Tragic 44.3% |
| Ugandans | 0.4 /100 | #247 | Tragic 44.2% |
| Nicaraguans | 0.3 /100 | #248 | Tragic 44.2% |
| Immigrants | Cameroon | 0.3 /100 | #249 | Tragic 44.2% |
| Immigrants | Eastern Africa | 0.3 /100 | #250 | Tragic 44.2% |
| Blackfeet | 0.3 /100 | #251 | Tragic 44.2% |