Immigrants vs Yugoslavian Currently Married
COMPARE
Immigrants
Yugoslavian
Currently Married
Currently Married Comparison
Immigrants
Yugoslavians
45.8%
CURRENTLY MARRIED
11.2/ 100
METRIC RATING
206th/ 347
METRIC RANK
47.2%
CURRENTLY MARRIED
77.4/ 100
METRIC RATING
139th/ 347
METRIC RANK
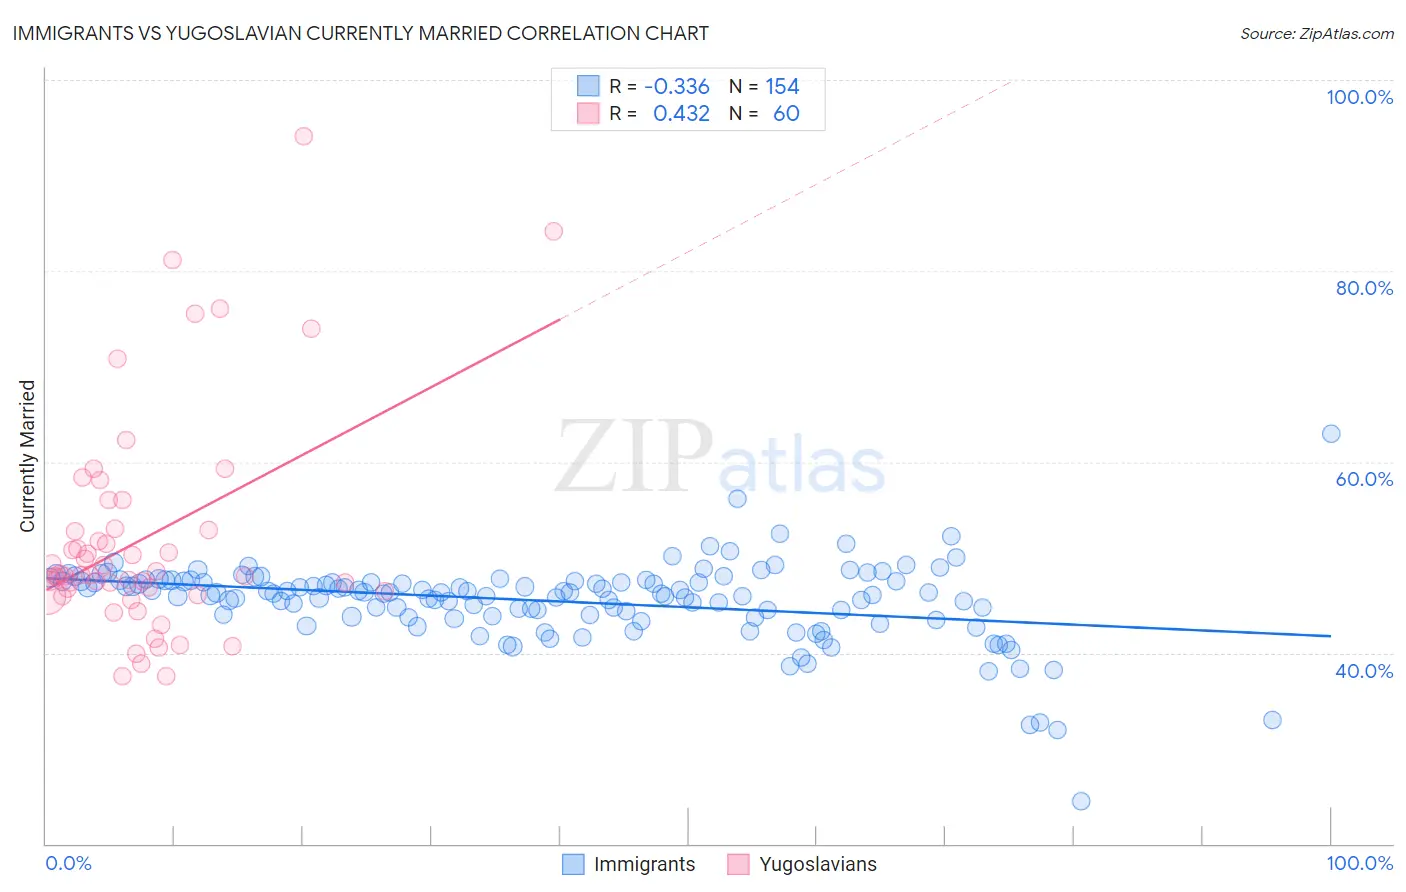
Immigrants vs Yugoslavian Currently Married Correlation Chart
The statistical analysis conducted on geographies consisting of 577,640,121 people shows a mild negative correlation between the proportion of Immigrants and percentage of population currently married in the United States with a correlation coefficient (R) of -0.336 and weighted average of 45.8%. Similarly, the statistical analysis conducted on geographies consisting of 285,712,182 people shows a moderate positive correlation between the proportion of Yugoslavians and percentage of population currently married in the United States with a correlation coefficient (R) of 0.432 and weighted average of 47.2%, a difference of 3.1%.
Currently Married Correlation Summary
| Measurement | Immigrants | Yugoslavian |
| Minimum | 24.5% | 37.5% |
| Maximum | 62.9% | 94.1% |
| Range | 38.5% | 56.6% |
| Mean | 45.4% | 52.0% |
| Median | 46.3% | 48.2% |
| Interquartile 25% (IQ1) | 43.8% | 46.2% |
| Interquartile 75% (IQ3) | 47.5% | 52.9% |
| Interquartile Range (IQR) | 3.7% | 6.7% |
| Standard Deviation (Sample) | 4.2% | 11.6% |
| Standard Deviation (Population) | 4.2% | 11.5% |
Similar Demographics by Currently Married
Demographics Similar to Immigrants by Currently Married
In terms of currently married, the demographic groups most similar to Immigrants are South American Indian (45.8%, a difference of 0.020%), Taiwanese (45.8%, a difference of 0.040%), Immigrants from Spain (45.8%, a difference of 0.040%), Immigrants from South America (45.7%, a difference of 0.040%), and Alsatian (45.7%, a difference of 0.050%).
| Demographics | Rating | Rank | Currently Married |
| Immigrants | Costa Rica | 19.6 /100 | #199 | Poor 46.0% |
| Creek | 17.2 /100 | #200 | Poor 46.0% |
| Malaysians | 15.3 /100 | #201 | Poor 45.9% |
| Immigrants | Albania | 14.5 /100 | #202 | Poor 45.9% |
| Taiwanese | 11.7 /100 | #203 | Poor 45.8% |
| Immigrants | Spain | 11.6 /100 | #204 | Poor 45.8% |
| South American Indians | 11.5 /100 | #205 | Poor 45.8% |
| Immigrants | Immigrants | 11.2 /100 | #206 | Poor 45.8% |
| Immigrants | South America | 10.8 /100 | #207 | Poor 45.7% |
| Alsatians | 10.8 /100 | #208 | Poor 45.7% |
| Immigrants | Micronesia | 8.8 /100 | #209 | Tragic 45.6% |
| Uruguayans | 7.9 /100 | #210 | Tragic 45.6% |
| Houma | 7.2 /100 | #211 | Tragic 45.5% |
| Marshallese | 7.2 /100 | #212 | Tragic 45.5% |
| Alaska Natives | 7.0 /100 | #213 | Tragic 45.5% |
Demographics Similar to Yugoslavians by Currently Married
In terms of currently married, the demographic groups most similar to Yugoslavians are Pakistani (47.2%, a difference of 0.0%), Paraguayan (47.2%, a difference of 0.020%), Immigrants from Vietnam (47.2%, a difference of 0.040%), Cajun (47.1%, a difference of 0.11%), and Immigrants from Norway (47.2%, a difference of 0.12%).
| Demographics | Rating | Rank | Currently Married |
| Afghans | 81.8 /100 | #132 | Excellent 47.3% |
| Immigrants | Malaysia | 81.1 /100 | #133 | Excellent 47.3% |
| Immigrants | Australia | 81.1 /100 | #134 | Excellent 47.3% |
| Immigrants | Norway | 79.7 /100 | #135 | Good 47.2% |
| Immigrants | Vietnam | 78.2 /100 | #136 | Good 47.2% |
| Paraguayans | 77.8 /100 | #137 | Good 47.2% |
| Pakistanis | 77.5 /100 | #138 | Good 47.2% |
| Yugoslavians | 77.4 /100 | #139 | Good 47.2% |
| Cajuns | 75.3 /100 | #140 | Good 47.1% |
| Venezuelans | 74.4 /100 | #141 | Good 47.1% |
| Argentineans | 74.4 /100 | #142 | Good 47.1% |
| Guamanians/Chamorros | 74.2 /100 | #143 | Good 47.1% |
| Hmong | 73.4 /100 | #144 | Good 47.1% |
| Immigrants | South Eastern Asia | 72.9 /100 | #145 | Good 47.1% |
| Carpatho Rusyns | 72.6 /100 | #146 | Good 47.0% |