Immigrants from Fiji vs Yugoslavian Currently Married
COMPARE
Immigrants from Fiji
Yugoslavian
Currently Married
Currently Married Comparison
Immigrants from Fiji
Yugoslavians
46.2%
CURRENTLY MARRIED
25.0/ 100
METRIC RATING
193rd/ 347
METRIC RANK
47.2%
CURRENTLY MARRIED
77.4/ 100
METRIC RATING
139th/ 347
METRIC RANK
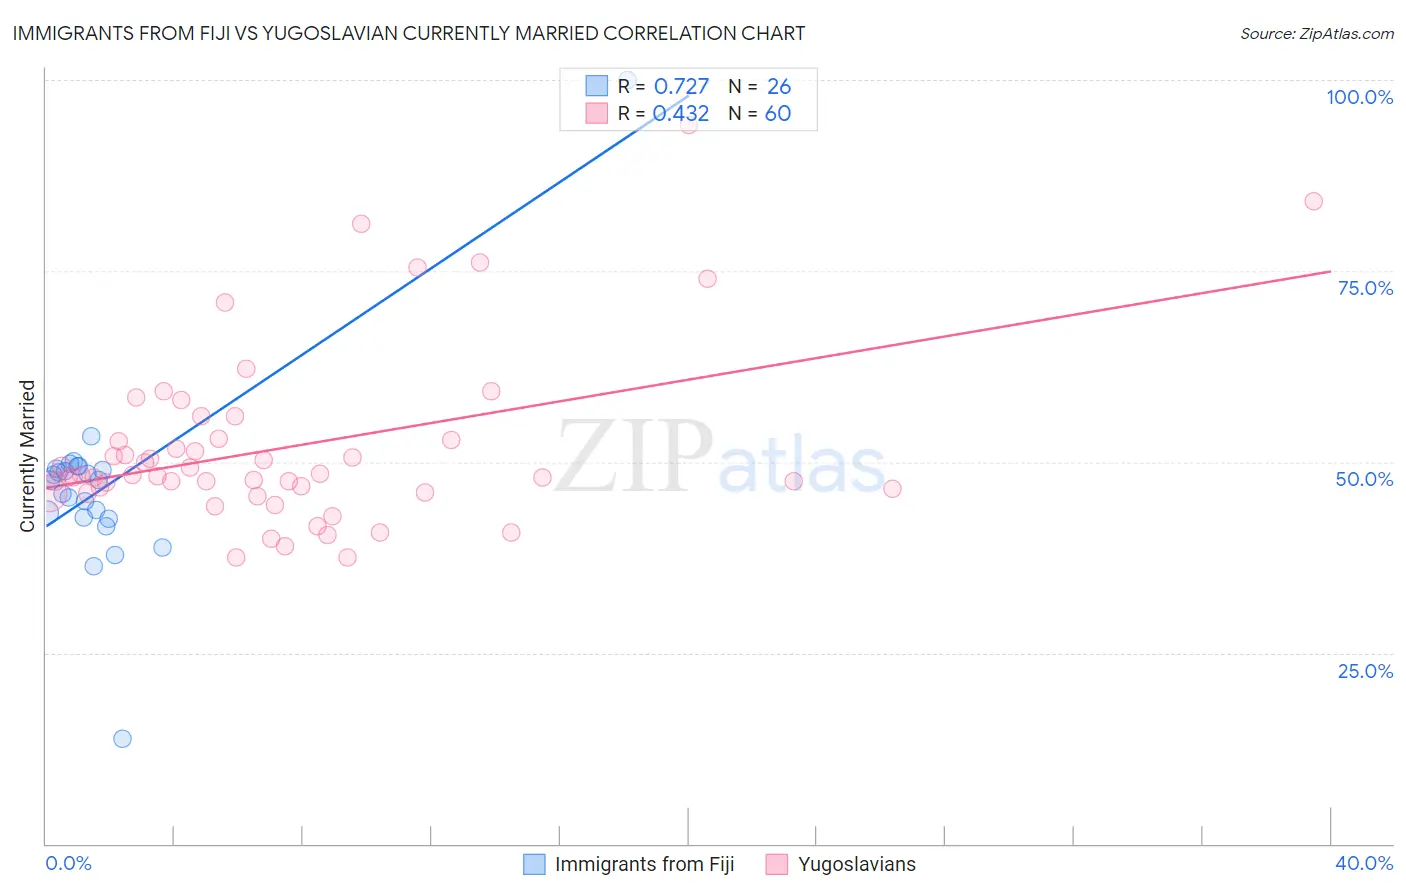
Immigrants from Fiji vs Yugoslavian Currently Married Correlation Chart
The statistical analysis conducted on geographies consisting of 93,756,204 people shows a strong positive correlation between the proportion of Immigrants from Fiji and percentage of population currently married in the United States with a correlation coefficient (R) of 0.727 and weighted average of 46.2%. Similarly, the statistical analysis conducted on geographies consisting of 285,712,182 people shows a moderate positive correlation between the proportion of Yugoslavians and percentage of population currently married in the United States with a correlation coefficient (R) of 0.432 and weighted average of 47.2%, a difference of 2.1%.
Currently Married Correlation Summary
| Measurement | Immigrants from Fiji | Yugoslavian |
| Minimum | 13.7% | 37.5% |
| Maximum | 100.0% | 94.1% |
| Range | 86.3% | 56.6% |
| Mean | 46.8% | 52.0% |
| Median | 47.6% | 48.2% |
| Interquartile 25% (IQ1) | 42.7% | 46.2% |
| Interquartile 75% (IQ3) | 49.1% | 52.9% |
| Interquartile Range (IQR) | 6.4% | 6.7% |
| Standard Deviation (Sample) | 13.2% | 11.6% |
| Standard Deviation (Population) | 13.0% | 11.5% |
Similar Demographics by Currently Married
Demographics Similar to Immigrants from Fiji by Currently Married
In terms of currently married, the demographic groups most similar to Immigrants from Fiji are Soviet Union (46.2%, a difference of 0.040%), South American (46.1%, a difference of 0.060%), Immigrants from Nepal (46.1%, a difference of 0.070%), Immigrants from France (46.2%, a difference of 0.13%), and Immigrants from Bosnia and Herzegovina (46.1%, a difference of 0.14%).
| Demographics | Rating | Rank | Currently Married |
| Immigrants | Chile | 36.8 /100 | #186 | Fair 46.4% |
| Immigrants | Peru | 35.3 /100 | #187 | Fair 46.4% |
| Colombians | 31.8 /100 | #188 | Fair 46.3% |
| Fijians | 30.3 /100 | #189 | Fair 46.3% |
| Choctaw | 29.1 /100 | #190 | Fair 46.3% |
| Immigrants | France | 27.7 /100 | #191 | Fair 46.2% |
| Soviet Union | 25.7 /100 | #192 | Fair 46.2% |
| Immigrants | Fiji | 25.0 /100 | #193 | Fair 46.2% |
| South Americans | 23.8 /100 | #194 | Fair 46.1% |
| Immigrants | Nepal | 23.7 /100 | #195 | Fair 46.1% |
| Immigrants | Bosnia and Herzegovina | 22.2 /100 | #196 | Fair 46.1% |
| Immigrants | Kuwait | 21.7 /100 | #197 | Fair 46.1% |
| Immigrants | Colombia | 21.0 /100 | #198 | Fair 46.1% |
| Immigrants | Costa Rica | 19.6 /100 | #199 | Poor 46.0% |
| Creek | 17.2 /100 | #200 | Poor 46.0% |
Demographics Similar to Yugoslavians by Currently Married
In terms of currently married, the demographic groups most similar to Yugoslavians are Pakistani (47.2%, a difference of 0.0%), Paraguayan (47.2%, a difference of 0.020%), Immigrants from Vietnam (47.2%, a difference of 0.040%), Cajun (47.1%, a difference of 0.11%), and Immigrants from Norway (47.2%, a difference of 0.12%).
| Demographics | Rating | Rank | Currently Married |
| Afghans | 81.8 /100 | #132 | Excellent 47.3% |
| Immigrants | Malaysia | 81.1 /100 | #133 | Excellent 47.3% |
| Immigrants | Australia | 81.1 /100 | #134 | Excellent 47.3% |
| Immigrants | Norway | 79.7 /100 | #135 | Good 47.2% |
| Immigrants | Vietnam | 78.2 /100 | #136 | Good 47.2% |
| Paraguayans | 77.8 /100 | #137 | Good 47.2% |
| Pakistanis | 77.5 /100 | #138 | Good 47.2% |
| Yugoslavians | 77.4 /100 | #139 | Good 47.2% |
| Cajuns | 75.3 /100 | #140 | Good 47.1% |
| Venezuelans | 74.4 /100 | #141 | Good 47.1% |
| Argentineans | 74.4 /100 | #142 | Good 47.1% |
| Guamanians/Chamorros | 74.2 /100 | #143 | Good 47.1% |
| Hmong | 73.4 /100 | #144 | Good 47.1% |
| Immigrants | South Eastern Asia | 72.9 /100 | #145 | Good 47.1% |
| Carpatho Rusyns | 72.6 /100 | #146 | Good 47.0% |