Jordanian vs Immigrants from Sudan Currently Married
COMPARE
Jordanian
Immigrants from Sudan
Currently Married
Currently Married Comparison
Jordanians
Immigrants from Sudan
48.0%
CURRENTLY MARRIED
96.2/ 100
METRIC RATING
87th/ 347
METRIC RANK
43.5%
CURRENTLY MARRIED
0.1/ 100
METRIC RATING
269th/ 347
METRIC RANK
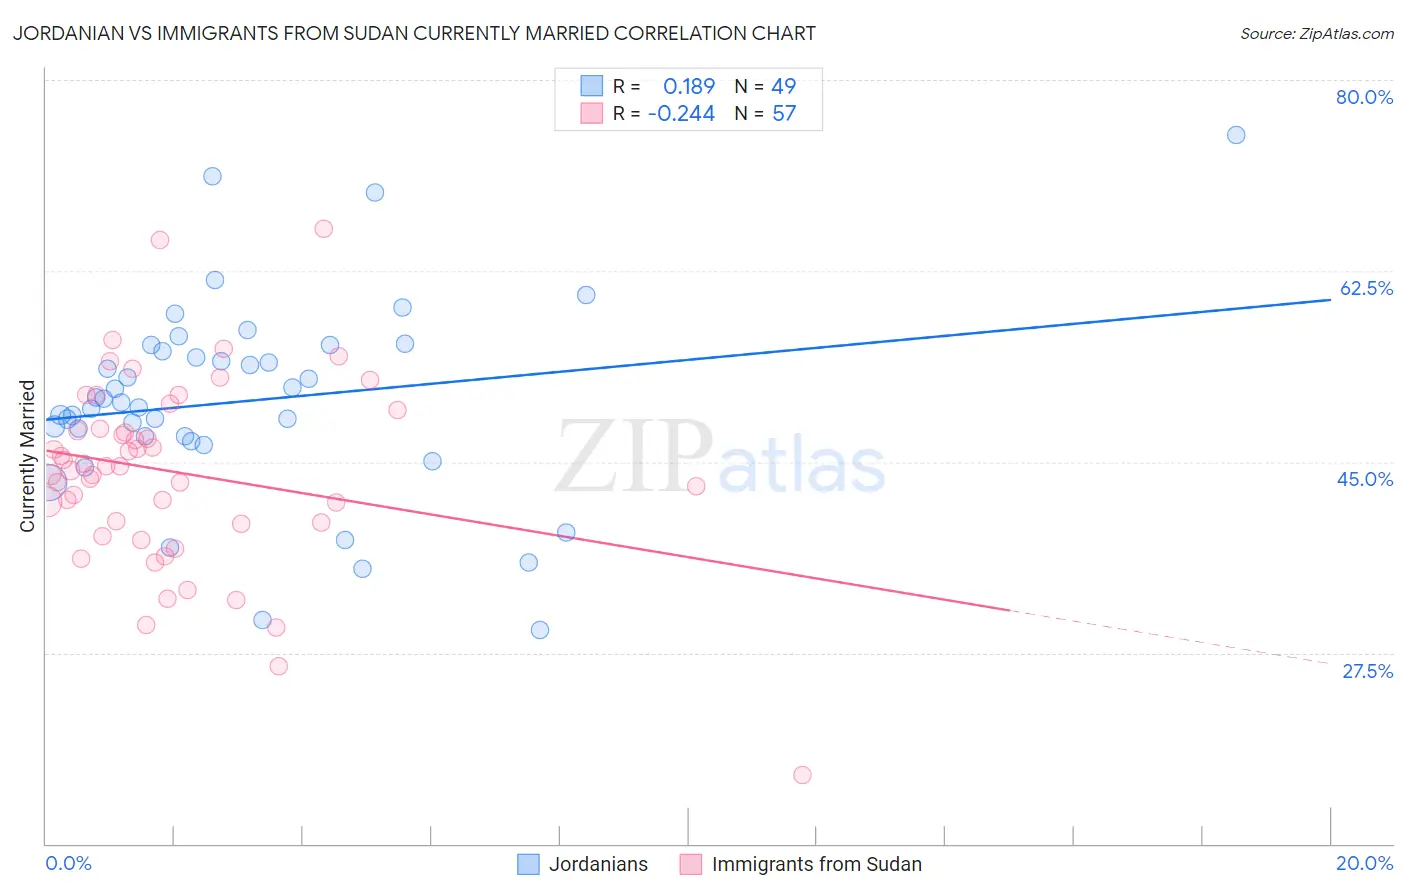
Jordanian vs Immigrants from Sudan Currently Married Correlation Chart
The statistical analysis conducted on geographies consisting of 166,415,795 people shows a poor positive correlation between the proportion of Jordanians and percentage of population currently married in the United States with a correlation coefficient (R) of 0.189 and weighted average of 48.0%. Similarly, the statistical analysis conducted on geographies consisting of 118,963,461 people shows a weak negative correlation between the proportion of Immigrants from Sudan and percentage of population currently married in the United States with a correlation coefficient (R) of -0.244 and weighted average of 43.5%, a difference of 10.3%.
Currently Married Correlation Summary
| Measurement | Jordanian | Immigrants from Sudan |
| Minimum | 29.6% | 16.3% |
| Maximum | 75.0% | 66.4% |
| Range | 45.4% | 50.1% |
| Mean | 50.6% | 44.1% |
| Median | 50.5% | 44.6% |
| Interquartile 25% (IQ1) | 47.1% | 39.4% |
| Interquartile 75% (IQ3) | 55.4% | 48.9% |
| Interquartile Range (IQR) | 8.3% | 9.6% |
| Standard Deviation (Sample) | 9.1% | 8.8% |
| Standard Deviation (Population) | 9.0% | 8.7% |
Similar Demographics by Currently Married
Demographics Similar to Jordanians by Currently Married
In terms of currently married, the demographic groups most similar to Jordanians are Immigrants from Japan (48.0%, a difference of 0.010%), Immigrants from Eastern Europe (48.0%, a difference of 0.020%), French Canadian (48.0%, a difference of 0.040%), Indian (Asian) (48.0%, a difference of 0.080%), and American (48.0%, a difference of 0.10%).
| Demographics | Rating | Rank | Currently Married |
| Immigrants | Poland | 96.9 /100 | #80 | Exceptional 48.1% |
| Immigrants | Sri Lanka | 96.9 /100 | #81 | Exceptional 48.1% |
| Immigrants | Europe | 96.9 /100 | #82 | Exceptional 48.1% |
| Bolivians | 96.9 /100 | #83 | Exceptional 48.1% |
| Immigrants | Israel | 96.9 /100 | #84 | Exceptional 48.1% |
| French Canadians | 96.3 /100 | #85 | Exceptional 48.0% |
| Immigrants | Japan | 96.2 /100 | #86 | Exceptional 48.0% |
| Jordanians | 96.2 /100 | #87 | Exceptional 48.0% |
| Immigrants | Eastern Europe | 96.1 /100 | #88 | Exceptional 48.0% |
| Indians (Asian) | 95.8 /100 | #89 | Exceptional 48.0% |
| Americans | 95.7 /100 | #90 | Exceptional 48.0% |
| Immigrants | Bolivia | 95.6 /100 | #91 | Exceptional 47.9% |
| Koreans | 95.4 /100 | #92 | Exceptional 47.9% |
| Lebanese | 95.1 /100 | #93 | Exceptional 47.9% |
| Native Hawaiians | 95.0 /100 | #94 | Exceptional 47.9% |
Demographics Similar to Immigrants from Sudan by Currently Married
In terms of currently married, the demographic groups most similar to Immigrants from Sudan are Salvadoran (43.5%, a difference of 0.080%), Bermudan (43.5%, a difference of 0.090%), Spanish American Indian (43.6%, a difference of 0.12%), Immigrants from Eritrea (43.6%, a difference of 0.13%), and Indonesian (43.5%, a difference of 0.13%).
| Demographics | Rating | Rank | Currently Married |
| Bangladeshis | 0.1 /100 | #262 | Tragic 43.7% |
| Immigrants | Cuba | 0.1 /100 | #263 | Tragic 43.7% |
| Sudanese | 0.1 /100 | #264 | Tragic 43.7% |
| Immigrants | Bangladesh | 0.1 /100 | #265 | Tragic 43.6% |
| Ecuadorians | 0.1 /100 | #266 | Tragic 43.6% |
| Immigrants | Eritrea | 0.1 /100 | #267 | Tragic 43.6% |
| Spanish American Indians | 0.1 /100 | #268 | Tragic 43.6% |
| Immigrants | Sudan | 0.1 /100 | #269 | Tragic 43.5% |
| Salvadorans | 0.1 /100 | #270 | Tragic 43.5% |
| Bermudans | 0.1 /100 | #271 | Tragic 43.5% |
| Indonesians | 0.1 /100 | #272 | Tragic 43.5% |
| Yaqui | 0.1 /100 | #273 | Tragic 43.4% |
| Nigerians | 0.1 /100 | #274 | Tragic 43.4% |
| Colville | 0.1 /100 | #275 | Tragic 43.4% |
| Sierra Leoneans | 0.1 /100 | #276 | Tragic 43.4% |