Jordanian vs Soviet Union Currently Married
COMPARE
Jordanian
Soviet Union
Currently Married
Currently Married Comparison
Jordanians
Soviet Union
48.0%
CURRENTLY MARRIED
96.2/ 100
METRIC RATING
87th/ 347
METRIC RANK
46.2%
CURRENTLY MARRIED
25.7/ 100
METRIC RATING
192nd/ 347
METRIC RANK
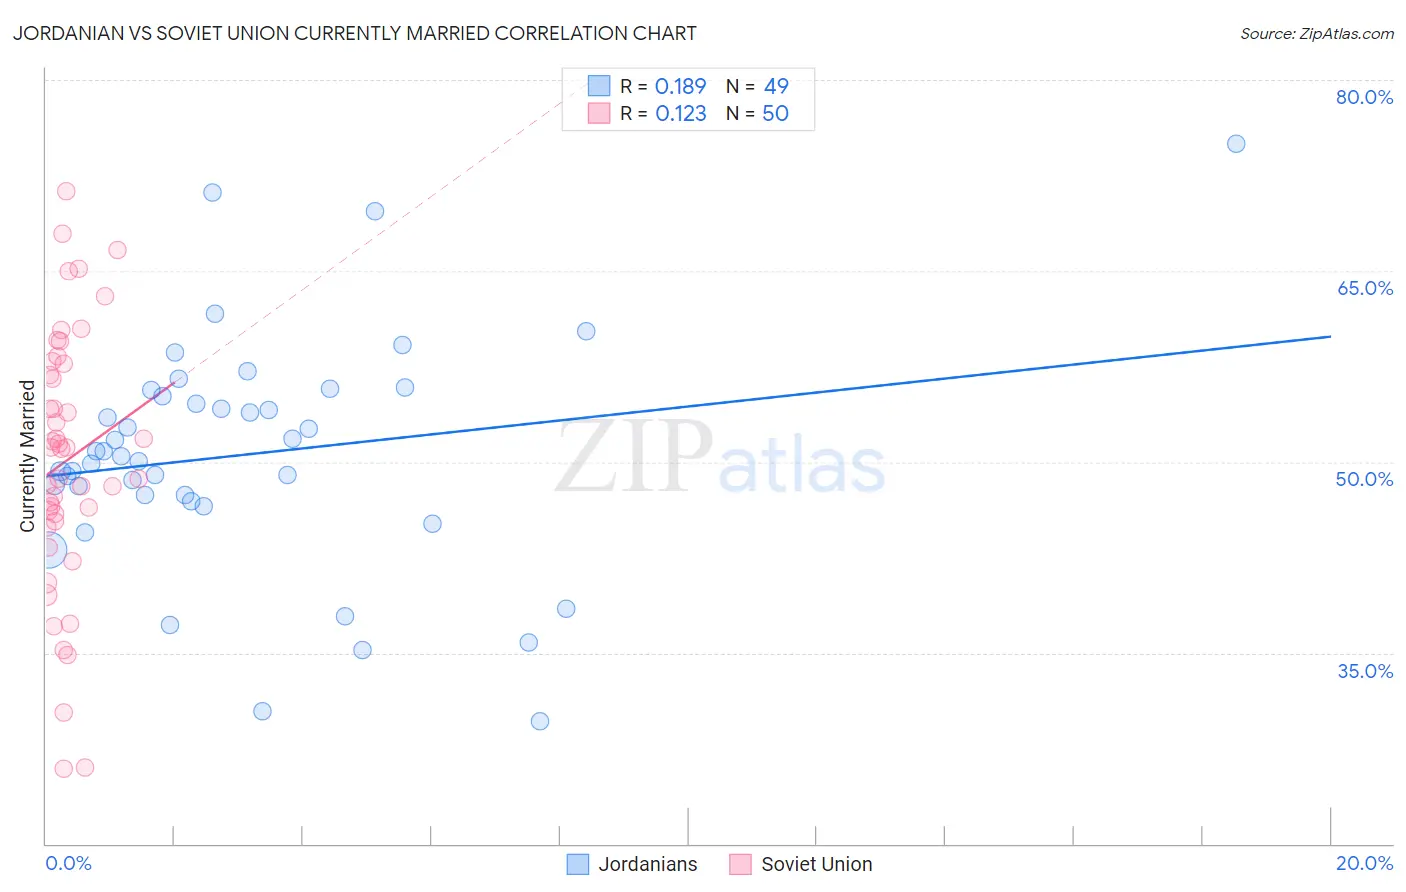
Jordanian vs Soviet Union Currently Married Correlation Chart
The statistical analysis conducted on geographies consisting of 166,415,795 people shows a poor positive correlation between the proportion of Jordanians and percentage of population currently married in the United States with a correlation coefficient (R) of 0.189 and weighted average of 48.0%. Similarly, the statistical analysis conducted on geographies consisting of 43,514,626 people shows a poor positive correlation between the proportion of Soviet Union and percentage of population currently married in the United States with a correlation coefficient (R) of 0.123 and weighted average of 46.2%, a difference of 4.0%.
Currently Married Correlation Summary
| Measurement | Jordanian | Soviet Union |
| Minimum | 29.6% | 25.9% |
| Maximum | 75.0% | 71.3% |
| Range | 45.4% | 45.4% |
| Mean | 50.6% | 50.1% |
| Median | 50.5% | 51.1% |
| Interquartile 25% (IQ1) | 47.1% | 45.4% |
| Interquartile 75% (IQ3) | 55.4% | 57.7% |
| Interquartile Range (IQR) | 8.3% | 12.3% |
| Standard Deviation (Sample) | 9.1% | 10.3% |
| Standard Deviation (Population) | 9.0% | 10.2% |
Similar Demographics by Currently Married
Demographics Similar to Jordanians by Currently Married
In terms of currently married, the demographic groups most similar to Jordanians are Immigrants from Japan (48.0%, a difference of 0.010%), Immigrants from Eastern Europe (48.0%, a difference of 0.020%), French Canadian (48.0%, a difference of 0.040%), Indian (Asian) (48.0%, a difference of 0.080%), and American (48.0%, a difference of 0.10%).
| Demographics | Rating | Rank | Currently Married |
| Immigrants | Poland | 96.9 /100 | #80 | Exceptional 48.1% |
| Immigrants | Sri Lanka | 96.9 /100 | #81 | Exceptional 48.1% |
| Immigrants | Europe | 96.9 /100 | #82 | Exceptional 48.1% |
| Bolivians | 96.9 /100 | #83 | Exceptional 48.1% |
| Immigrants | Israel | 96.9 /100 | #84 | Exceptional 48.1% |
| French Canadians | 96.3 /100 | #85 | Exceptional 48.0% |
| Immigrants | Japan | 96.2 /100 | #86 | Exceptional 48.0% |
| Jordanians | 96.2 /100 | #87 | Exceptional 48.0% |
| Immigrants | Eastern Europe | 96.1 /100 | #88 | Exceptional 48.0% |
| Indians (Asian) | 95.8 /100 | #89 | Exceptional 48.0% |
| Americans | 95.7 /100 | #90 | Exceptional 48.0% |
| Immigrants | Bolivia | 95.6 /100 | #91 | Exceptional 47.9% |
| Koreans | 95.4 /100 | #92 | Exceptional 47.9% |
| Lebanese | 95.1 /100 | #93 | Exceptional 47.9% |
| Native Hawaiians | 95.0 /100 | #94 | Exceptional 47.9% |
Demographics Similar to Soviet Union by Currently Married
In terms of currently married, the demographic groups most similar to Soviet Union are Immigrants from Fiji (46.2%, a difference of 0.040%), Immigrants from France (46.2%, a difference of 0.090%), South American (46.1%, a difference of 0.10%), Immigrants from Nepal (46.1%, a difference of 0.10%), and Choctaw (46.3%, a difference of 0.16%).
| Demographics | Rating | Rank | Currently Married |
| Mongolians | 37.6 /100 | #185 | Fair 46.4% |
| Immigrants | Chile | 36.8 /100 | #186 | Fair 46.4% |
| Immigrants | Peru | 35.3 /100 | #187 | Fair 46.4% |
| Colombians | 31.8 /100 | #188 | Fair 46.3% |
| Fijians | 30.3 /100 | #189 | Fair 46.3% |
| Choctaw | 29.1 /100 | #190 | Fair 46.3% |
| Immigrants | France | 27.7 /100 | #191 | Fair 46.2% |
| Soviet Union | 25.7 /100 | #192 | Fair 46.2% |
| Immigrants | Fiji | 25.0 /100 | #193 | Fair 46.2% |
| South Americans | 23.8 /100 | #194 | Fair 46.1% |
| Immigrants | Nepal | 23.7 /100 | #195 | Fair 46.1% |
| Immigrants | Bosnia and Herzegovina | 22.2 /100 | #196 | Fair 46.1% |
| Immigrants | Kuwait | 21.7 /100 | #197 | Fair 46.1% |
| Immigrants | Colombia | 21.0 /100 | #198 | Fair 46.1% |
| Immigrants | Costa Rica | 19.6 /100 | #199 | Poor 46.0% |