Jordanian vs Immigrants from Western Africa Currently Married
COMPARE
Jordanian
Immigrants from Western Africa
Currently Married
Currently Married Comparison
Jordanians
Immigrants from Western Africa
48.0%
CURRENTLY MARRIED
96.2/ 100
METRIC RATING
87th/ 347
METRIC RANK
42.4%
CURRENTLY MARRIED
0.0/ 100
METRIC RATING
295th/ 347
METRIC RANK
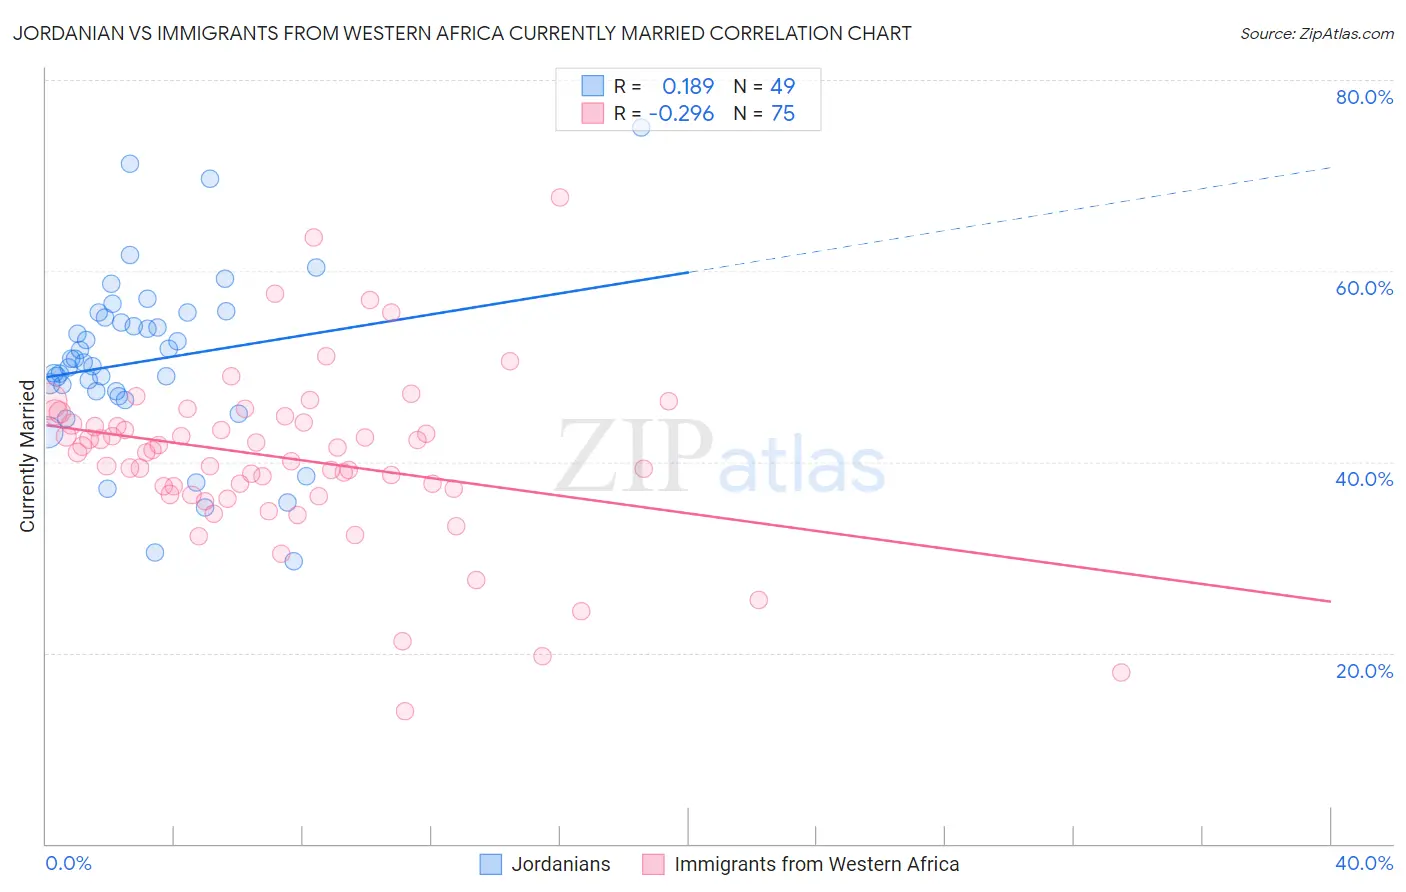
Jordanian vs Immigrants from Western Africa Currently Married Correlation Chart
The statistical analysis conducted on geographies consisting of 166,415,795 people shows a poor positive correlation between the proportion of Jordanians and percentage of population currently married in the United States with a correlation coefficient (R) of 0.189 and weighted average of 48.0%. Similarly, the statistical analysis conducted on geographies consisting of 357,817,257 people shows a weak negative correlation between the proportion of Immigrants from Western Africa and percentage of population currently married in the United States with a correlation coefficient (R) of -0.296 and weighted average of 42.4%, a difference of 13.3%.
Currently Married Correlation Summary
| Measurement | Jordanian | Immigrants from Western Africa |
| Minimum | 29.6% | 13.9% |
| Maximum | 75.0% | 67.7% |
| Range | 45.4% | 53.8% |
| Mean | 50.6% | 40.3% |
| Median | 50.5% | 41.0% |
| Interquartile 25% (IQ1) | 47.1% | 36.6% |
| Interquartile 75% (IQ3) | 55.4% | 44.1% |
| Interquartile Range (IQR) | 8.3% | 7.5% |
| Standard Deviation (Sample) | 9.1% | 9.0% |
| Standard Deviation (Population) | 9.0% | 8.9% |
Similar Demographics by Currently Married
Demographics Similar to Jordanians by Currently Married
In terms of currently married, the demographic groups most similar to Jordanians are Immigrants from Japan (48.0%, a difference of 0.010%), Immigrants from Eastern Europe (48.0%, a difference of 0.020%), French Canadian (48.0%, a difference of 0.040%), Indian (Asian) (48.0%, a difference of 0.080%), and American (48.0%, a difference of 0.10%).
| Demographics | Rating | Rank | Currently Married |
| Immigrants | Poland | 96.9 /100 | #80 | Exceptional 48.1% |
| Immigrants | Sri Lanka | 96.9 /100 | #81 | Exceptional 48.1% |
| Immigrants | Europe | 96.9 /100 | #82 | Exceptional 48.1% |
| Bolivians | 96.9 /100 | #83 | Exceptional 48.1% |
| Immigrants | Israel | 96.9 /100 | #84 | Exceptional 48.1% |
| French Canadians | 96.3 /100 | #85 | Exceptional 48.0% |
| Immigrants | Japan | 96.2 /100 | #86 | Exceptional 48.0% |
| Jordanians | 96.2 /100 | #87 | Exceptional 48.0% |
| Immigrants | Eastern Europe | 96.1 /100 | #88 | Exceptional 48.0% |
| Indians (Asian) | 95.8 /100 | #89 | Exceptional 48.0% |
| Americans | 95.7 /100 | #90 | Exceptional 48.0% |
| Immigrants | Bolivia | 95.6 /100 | #91 | Exceptional 47.9% |
| Koreans | 95.4 /100 | #92 | Exceptional 47.9% |
| Lebanese | 95.1 /100 | #93 | Exceptional 47.9% |
| Native Hawaiians | 95.0 /100 | #94 | Exceptional 47.9% |
Demographics Similar to Immigrants from Western Africa by Currently Married
In terms of currently married, the demographic groups most similar to Immigrants from Western Africa are Menominee (42.3%, a difference of 0.21%), Cheyenne (42.2%, a difference of 0.31%), Honduran (42.5%, a difference of 0.33%), Immigrants from Honduras (42.2%, a difference of 0.40%), and Liberian (42.2%, a difference of 0.44%).
| Demographics | Rating | Rank | Currently Married |
| Natives/Alaskans | 0.0 /100 | #288 | Tragic 42.8% |
| Paiute | 0.0 /100 | #289 | Tragic 42.7% |
| Immigrants | Ghana | 0.0 /100 | #290 | Tragic 42.7% |
| Immigrants | Guatemala | 0.0 /100 | #291 | Tragic 42.6% |
| Sub-Saharan Africans | 0.0 /100 | #292 | Tragic 42.6% |
| Yuman | 0.0 /100 | #293 | Tragic 42.6% |
| Hondurans | 0.0 /100 | #294 | Tragic 42.5% |
| Immigrants | Western Africa | 0.0 /100 | #295 | Tragic 42.4% |
| Menominee | 0.0 /100 | #296 | Tragic 42.3% |
| Cheyenne | 0.0 /100 | #297 | Tragic 42.2% |
| Immigrants | Honduras | 0.0 /100 | #298 | Tragic 42.2% |
| Liberians | 0.0 /100 | #299 | Tragic 42.2% |
| Belizeans | 0.0 /100 | #300 | Tragic 42.2% |
| Immigrants | Yemen | 0.0 /100 | #301 | Tragic 42.1% |
| Immigrants | Zaire | 0.0 /100 | #302 | Tragic 42.0% |