Barbadian vs Yugoslavian Currently Married
COMPARE
Barbadian
Yugoslavian
Currently Married
Currently Married Comparison
Barbadians
Yugoslavians
40.6%
CURRENTLY MARRIED
0.0/ 100
METRIC RATING
326th/ 347
METRIC RANK
47.2%
CURRENTLY MARRIED
77.4/ 100
METRIC RATING
139th/ 347
METRIC RANK
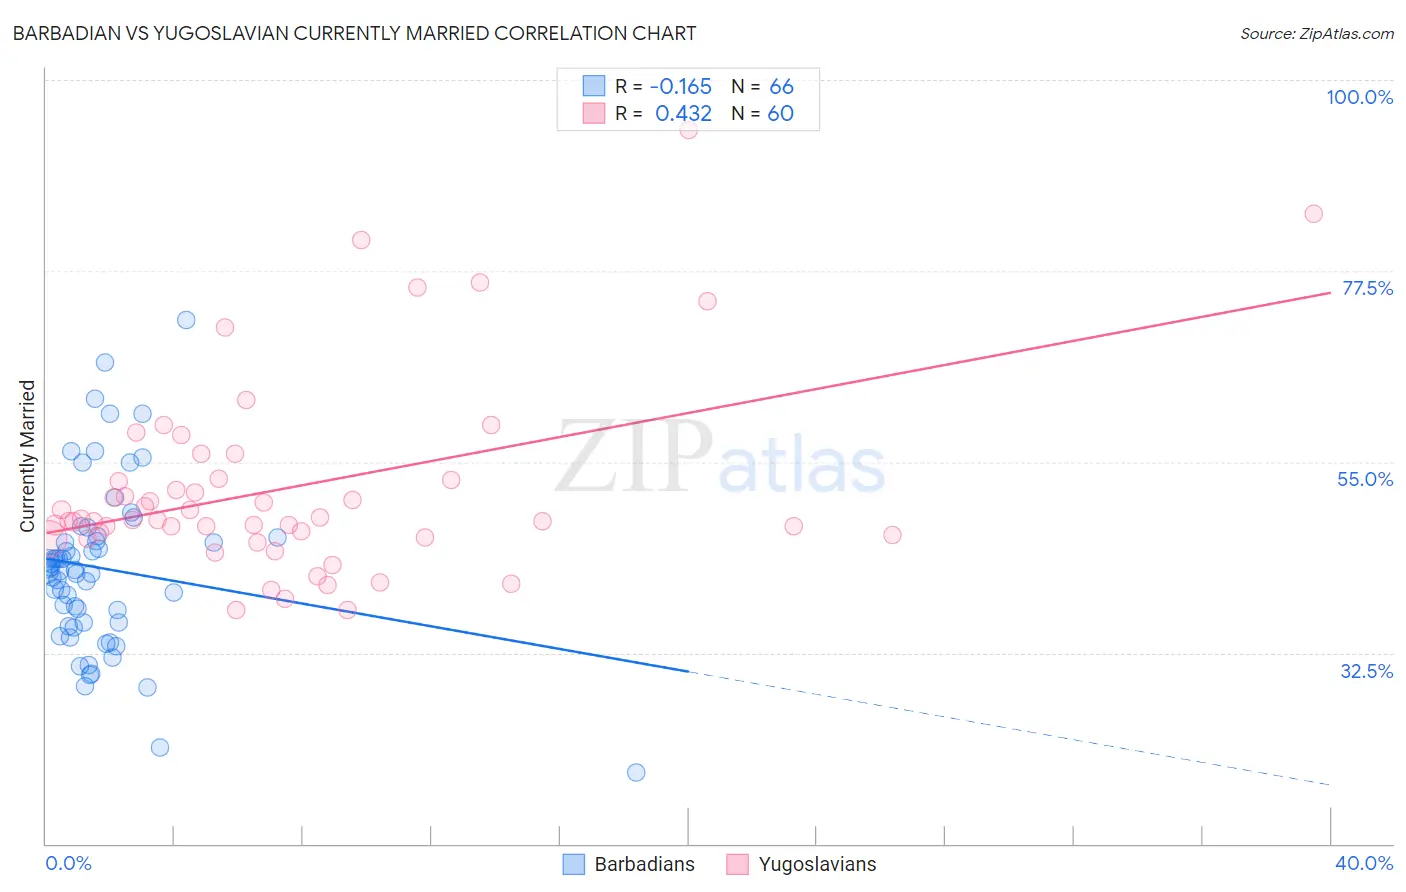
Barbadian vs Yugoslavian Currently Married Correlation Chart
The statistical analysis conducted on geographies consisting of 141,300,179 people shows a poor negative correlation between the proportion of Barbadians and percentage of population currently married in the United States with a correlation coefficient (R) of -0.165 and weighted average of 40.6%. Similarly, the statistical analysis conducted on geographies consisting of 285,712,182 people shows a moderate positive correlation between the proportion of Yugoslavians and percentage of population currently married in the United States with a correlation coefficient (R) of 0.432 and weighted average of 47.2%, a difference of 16.1%.
Currently Married Correlation Summary
| Measurement | Barbadian | Yugoslavian |
| Minimum | 18.4% | 37.5% |
| Maximum | 71.7% | 94.1% |
| Range | 53.3% | 56.6% |
| Mean | 42.5% | 52.0% |
| Median | 42.2% | 48.2% |
| Interquartile 25% (IQ1) | 36.0% | 46.2% |
| Interquartile 75% (IQ3) | 46.1% | 52.9% |
| Interquartile Range (IQR) | 10.1% | 6.7% |
| Standard Deviation (Sample) | 9.9% | 11.6% |
| Standard Deviation (Population) | 9.9% | 11.5% |
Similar Demographics by Currently Married
Demographics Similar to Barbadians by Currently Married
In terms of currently married, the demographic groups most similar to Barbadians are U.S. Virgin Islander (40.7%, a difference of 0.14%), Senegalese (40.6%, a difference of 0.17%), Immigrants from Senegal (40.7%, a difference of 0.19%), Immigrants from West Indies (40.7%, a difference of 0.20%), and Arapaho (40.5%, a difference of 0.22%).
| Demographics | Rating | Rank | Currently Married |
| Immigrants | Somalia | 0.0 /100 | #319 | Tragic 41.2% |
| Immigrants | Jamaica | 0.0 /100 | #320 | Tragic 41.1% |
| Immigrants | Congo | 0.0 /100 | #321 | Tragic 41.1% |
| Immigrants | Haiti | 0.0 /100 | #322 | Tragic 41.0% |
| Immigrants | West Indies | 0.0 /100 | #323 | Tragic 40.7% |
| Immigrants | Senegal | 0.0 /100 | #324 | Tragic 40.7% |
| U.S. Virgin Islanders | 0.0 /100 | #325 | Tragic 40.7% |
| Barbadians | 0.0 /100 | #326 | Tragic 40.6% |
| Senegalese | 0.0 /100 | #327 | Tragic 40.6% |
| Arapaho | 0.0 /100 | #328 | Tragic 40.5% |
| Crow | 0.0 /100 | #329 | Tragic 40.4% |
| Immigrants | Dominica | 0.0 /100 | #330 | Tragic 40.3% |
| Immigrants | Barbados | 0.0 /100 | #331 | Tragic 40.3% |
| Immigrants | St. Vincent and the Grenadines | 0.0 /100 | #332 | Tragic 40.1% |
| Yup'ik | 0.0 /100 | #333 | Tragic 39.9% |
Demographics Similar to Yugoslavians by Currently Married
In terms of currently married, the demographic groups most similar to Yugoslavians are Pakistani (47.2%, a difference of 0.0%), Paraguayan (47.2%, a difference of 0.020%), Immigrants from Vietnam (47.2%, a difference of 0.040%), Cajun (47.1%, a difference of 0.11%), and Immigrants from Norway (47.2%, a difference of 0.12%).
| Demographics | Rating | Rank | Currently Married |
| Afghans | 81.8 /100 | #132 | Excellent 47.3% |
| Immigrants | Malaysia | 81.1 /100 | #133 | Excellent 47.3% |
| Immigrants | Australia | 81.1 /100 | #134 | Excellent 47.3% |
| Immigrants | Norway | 79.7 /100 | #135 | Good 47.2% |
| Immigrants | Vietnam | 78.2 /100 | #136 | Good 47.2% |
| Paraguayans | 77.8 /100 | #137 | Good 47.2% |
| Pakistanis | 77.5 /100 | #138 | Good 47.2% |
| Yugoslavians | 77.4 /100 | #139 | Good 47.2% |
| Cajuns | 75.3 /100 | #140 | Good 47.1% |
| Venezuelans | 74.4 /100 | #141 | Good 47.1% |
| Argentineans | 74.4 /100 | #142 | Good 47.1% |
| Guamanians/Chamorros | 74.2 /100 | #143 | Good 47.1% |
| Hmong | 73.4 /100 | #144 | Good 47.1% |
| Immigrants | South Eastern Asia | 72.9 /100 | #145 | Good 47.1% |
| Carpatho Rusyns | 72.6 /100 | #146 | Good 47.0% |