Mexican American Indian vs Yugoslavian Currently Married
COMPARE
Mexican American Indian
Yugoslavian
Currently Married
Currently Married Comparison
Mexican American Indians
Yugoslavians
44.5%
CURRENTLY MARRIED
0.7/ 100
METRIC RATING
240th/ 347
METRIC RANK
47.2%
CURRENTLY MARRIED
77.4/ 100
METRIC RATING
139th/ 347
METRIC RANK
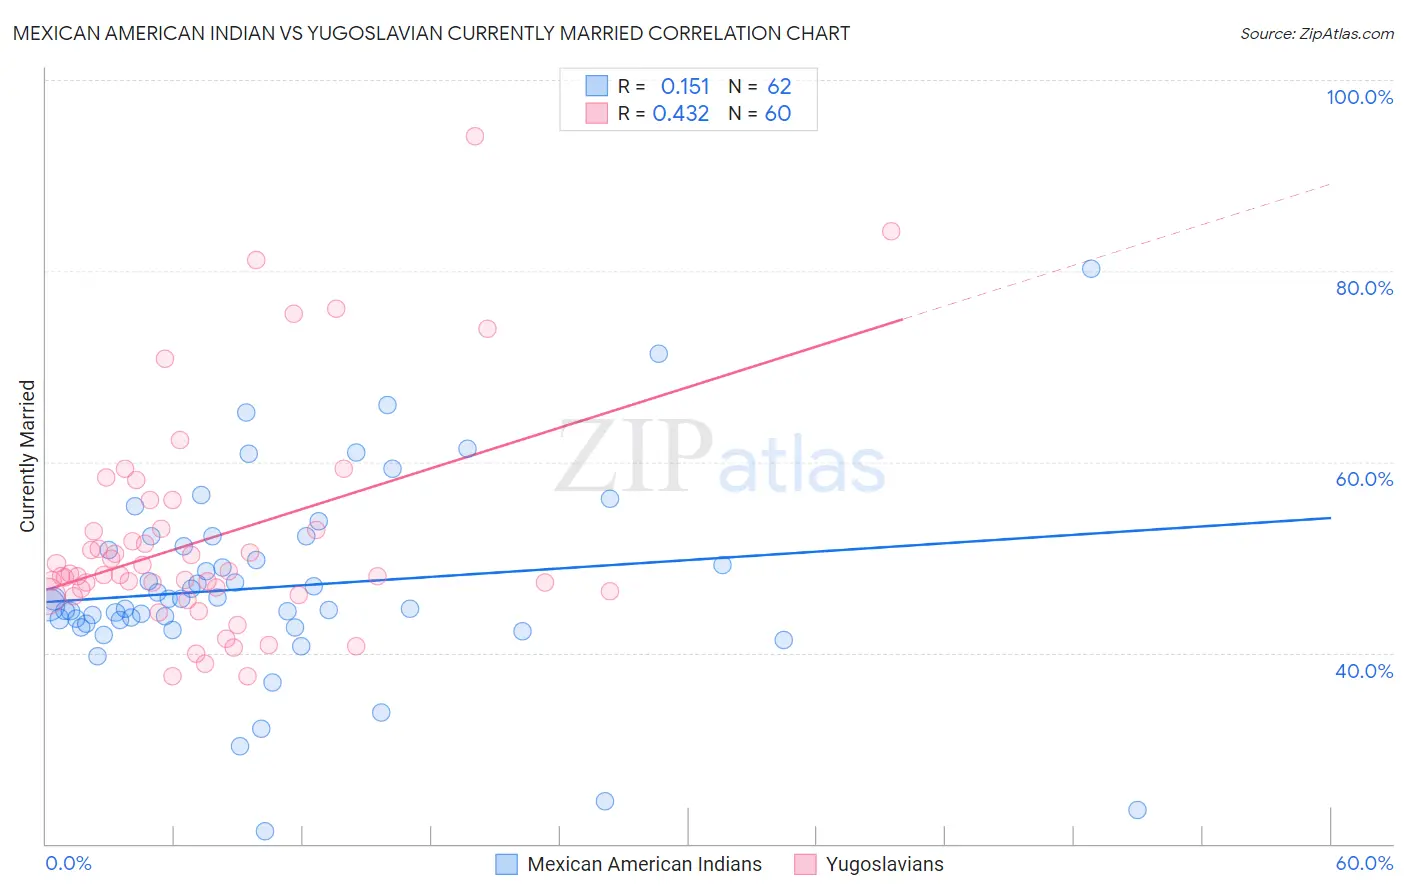
Mexican American Indian vs Yugoslavian Currently Married Correlation Chart
The statistical analysis conducted on geographies consisting of 317,602,518 people shows a poor positive correlation between the proportion of Mexican American Indians and percentage of population currently married in the United States with a correlation coefficient (R) of 0.151 and weighted average of 44.5%. Similarly, the statistical analysis conducted on geographies consisting of 285,712,182 people shows a moderate positive correlation between the proportion of Yugoslavians and percentage of population currently married in the United States with a correlation coefficient (R) of 0.432 and weighted average of 47.2%, a difference of 5.9%.
Currently Married Correlation Summary
| Measurement | Mexican American Indian | Yugoslavian |
| Minimum | 21.3% | 37.5% |
| Maximum | 80.2% | 94.1% |
| Range | 58.9% | 56.6% |
| Mean | 46.9% | 52.0% |
| Median | 45.3% | 48.2% |
| Interquartile 25% (IQ1) | 43.0% | 46.2% |
| Interquartile 75% (IQ3) | 51.2% | 52.9% |
| Interquartile Range (IQR) | 8.1% | 6.7% |
| Standard Deviation (Sample) | 10.3% | 11.6% |
| Standard Deviation (Population) | 10.2% | 11.5% |
Similar Demographics by Currently Married
Demographics Similar to Mexican American Indians by Currently Married
In terms of currently married, the demographic groups most similar to Mexican American Indians are Immigrants from Mexico (44.5%, a difference of 0.0%), Ethiopian (44.5%, a difference of 0.060%), Immigrants from Cambodia (44.5%, a difference of 0.090%), Immigrants from Ethiopia (44.5%, a difference of 0.10%), and Moroccan (44.6%, a difference of 0.14%).
| Demographics | Rating | Rank | Currently Married |
| Immigrants | Saudi Arabia | 1.1 /100 | #233 | Tragic 44.7% |
| Iroquois | 1.1 /100 | #234 | Tragic 44.7% |
| Alaskan Athabascans | 0.9 /100 | #235 | Tragic 44.6% |
| Cubans | 0.9 /100 | #236 | Tragic 44.6% |
| Seminole | 0.9 /100 | #237 | Tragic 44.6% |
| Moroccans | 0.9 /100 | #238 | Tragic 44.6% |
| Immigrants | Mexico | 0.7 /100 | #239 | Tragic 44.5% |
| Mexican American Indians | 0.7 /100 | #240 | Tragic 44.5% |
| Ethiopians | 0.7 /100 | #241 | Tragic 44.5% |
| Immigrants | Cambodia | 0.7 /100 | #242 | Tragic 44.5% |
| Immigrants | Ethiopia | 0.7 /100 | #243 | Tragic 44.5% |
| Japanese | 0.6 /100 | #244 | Tragic 44.5% |
| Immigrants | Armenia | 0.4 /100 | #245 | Tragic 44.3% |
| Immigrants | Burma/Myanmar | 0.4 /100 | #246 | Tragic 44.3% |
| Ugandans | 0.4 /100 | #247 | Tragic 44.2% |
Demographics Similar to Yugoslavians by Currently Married
In terms of currently married, the demographic groups most similar to Yugoslavians are Pakistani (47.2%, a difference of 0.0%), Paraguayan (47.2%, a difference of 0.020%), Immigrants from Vietnam (47.2%, a difference of 0.040%), Cajun (47.1%, a difference of 0.11%), and Immigrants from Norway (47.2%, a difference of 0.12%).
| Demographics | Rating | Rank | Currently Married |
| Afghans | 81.8 /100 | #132 | Excellent 47.3% |
| Immigrants | Malaysia | 81.1 /100 | #133 | Excellent 47.3% |
| Immigrants | Australia | 81.1 /100 | #134 | Excellent 47.3% |
| Immigrants | Norway | 79.7 /100 | #135 | Good 47.2% |
| Immigrants | Vietnam | 78.2 /100 | #136 | Good 47.2% |
| Paraguayans | 77.8 /100 | #137 | Good 47.2% |
| Pakistanis | 77.5 /100 | #138 | Good 47.2% |
| Yugoslavians | 77.4 /100 | #139 | Good 47.2% |
| Cajuns | 75.3 /100 | #140 | Good 47.1% |
| Venezuelans | 74.4 /100 | #141 | Good 47.1% |
| Argentineans | 74.4 /100 | #142 | Good 47.1% |
| Guamanians/Chamorros | 74.2 /100 | #143 | Good 47.1% |
| Hmong | 73.4 /100 | #144 | Good 47.1% |
| Immigrants | South Eastern Asia | 72.9 /100 | #145 | Good 47.1% |
| Carpatho Rusyns | 72.6 /100 | #146 | Good 47.0% |