Jordanian vs Yup'ik Currently Married
COMPARE
Jordanian
Yup'ik
Currently Married
Currently Married Comparison
Jordanians
Yup'ik
48.0%
CURRENTLY MARRIED
96.2/ 100
METRIC RATING
87th/ 347
METRIC RANK
39.9%
CURRENTLY MARRIED
0.0/ 100
METRIC RATING
333rd/ 347
METRIC RANK
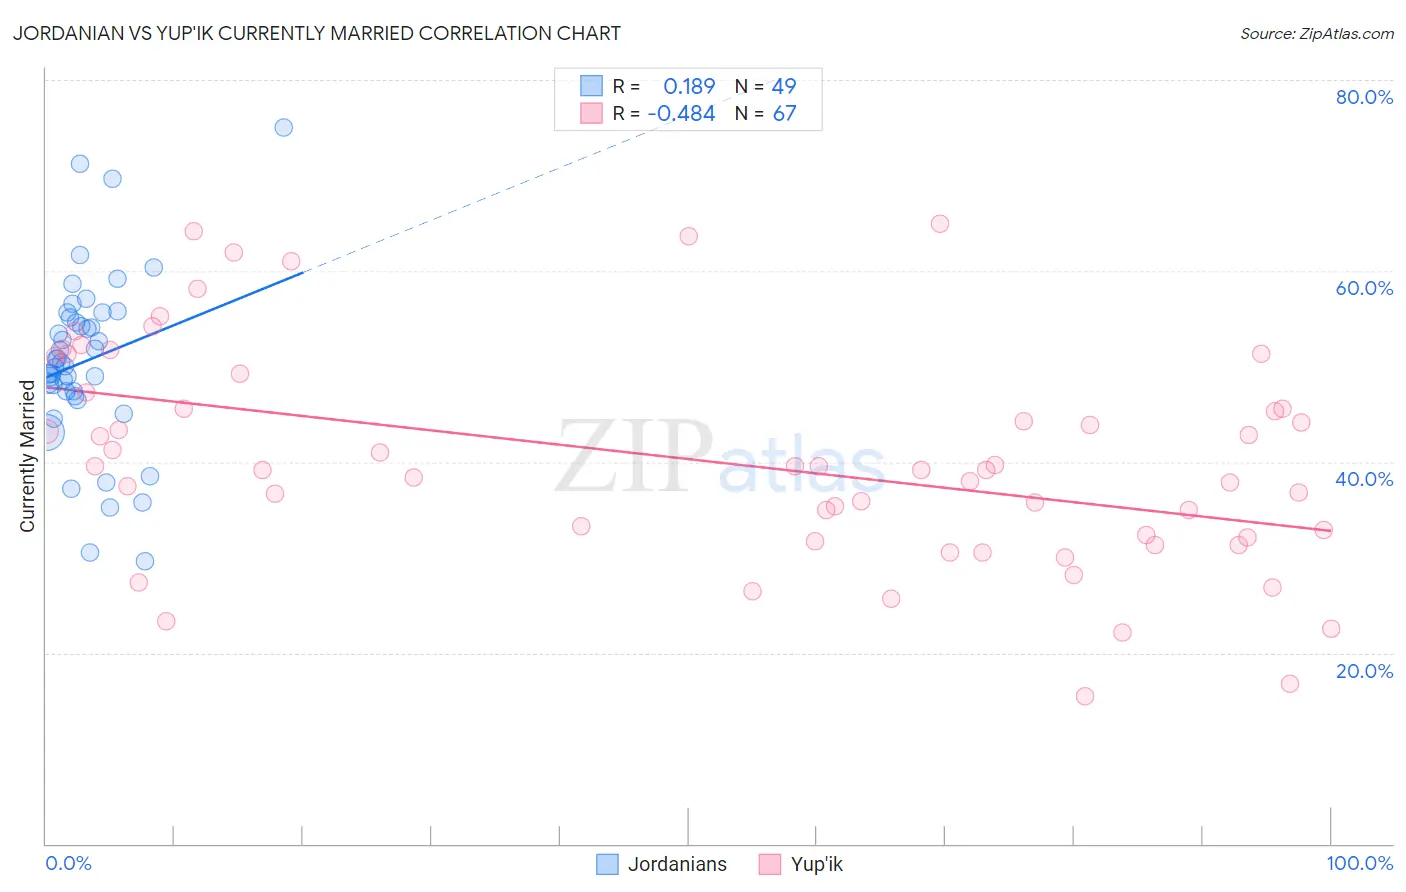
Jordanian vs Yup'ik Currently Married Correlation Chart
The statistical analysis conducted on geographies consisting of 166,415,795 people shows a poor positive correlation between the proportion of Jordanians and percentage of population currently married in the United States with a correlation coefficient (R) of 0.189 and weighted average of 48.0%. Similarly, the statistical analysis conducted on geographies consisting of 39,963,234 people shows a moderate negative correlation between the proportion of Yup'ik and percentage of population currently married in the United States with a correlation coefficient (R) of -0.484 and weighted average of 39.9%, a difference of 20.3%.
Currently Married Correlation Summary
| Measurement | Jordanian | Yup'ik |
| Minimum | 29.6% | 15.4% |
| Maximum | 75.0% | 65.0% |
| Range | 45.4% | 49.6% |
| Mean | 50.6% | 40.2% |
| Median | 50.5% | 39.2% |
| Interquartile 25% (IQ1) | 47.1% | 32.1% |
| Interquartile 75% (IQ3) | 55.4% | 47.3% |
| Interquartile Range (IQR) | 8.3% | 15.2% |
| Standard Deviation (Sample) | 9.1% | 11.4% |
| Standard Deviation (Population) | 9.0% | 11.3% |
Similar Demographics by Currently Married
Demographics Similar to Jordanians by Currently Married
In terms of currently married, the demographic groups most similar to Jordanians are Immigrants from Japan (48.0%, a difference of 0.010%), Immigrants from Eastern Europe (48.0%, a difference of 0.020%), French Canadian (48.0%, a difference of 0.040%), Indian (Asian) (48.0%, a difference of 0.080%), and American (48.0%, a difference of 0.10%).
| Demographics | Rating | Rank | Currently Married |
| Immigrants | Poland | 96.9 /100 | #80 | Exceptional 48.1% |
| Immigrants | Sri Lanka | 96.9 /100 | #81 | Exceptional 48.1% |
| Immigrants | Europe | 96.9 /100 | #82 | Exceptional 48.1% |
| Bolivians | 96.9 /100 | #83 | Exceptional 48.1% |
| Immigrants | Israel | 96.9 /100 | #84 | Exceptional 48.1% |
| French Canadians | 96.3 /100 | #85 | Exceptional 48.0% |
| Immigrants | Japan | 96.2 /100 | #86 | Exceptional 48.0% |
| Jordanians | 96.2 /100 | #87 | Exceptional 48.0% |
| Immigrants | Eastern Europe | 96.1 /100 | #88 | Exceptional 48.0% |
| Indians (Asian) | 95.8 /100 | #89 | Exceptional 48.0% |
| Americans | 95.7 /100 | #90 | Exceptional 48.0% |
| Immigrants | Bolivia | 95.6 /100 | #91 | Exceptional 47.9% |
| Koreans | 95.4 /100 | #92 | Exceptional 47.9% |
| Lebanese | 95.1 /100 | #93 | Exceptional 47.9% |
| Native Hawaiians | 95.0 /100 | #94 | Exceptional 47.9% |
Demographics Similar to Yup'ik by Currently Married
In terms of currently married, the demographic groups most similar to Yup'ik are Puerto Rican (39.9%, a difference of 0.010%), Lumbee (39.8%, a difference of 0.18%), British West Indian (39.8%, a difference of 0.35%), Immigrants from St. Vincent and the Grenadines (40.1%, a difference of 0.39%), and Black/African American (39.6%, a difference of 0.73%).
| Demographics | Rating | Rank | Currently Married |
| Barbadians | 0.0 /100 | #326 | Tragic 40.6% |
| Senegalese | 0.0 /100 | #327 | Tragic 40.6% |
| Arapaho | 0.0 /100 | #328 | Tragic 40.5% |
| Crow | 0.0 /100 | #329 | Tragic 40.4% |
| Immigrants | Dominica | 0.0 /100 | #330 | Tragic 40.3% |
| Immigrants | Barbados | 0.0 /100 | #331 | Tragic 40.3% |
| Immigrants | St. Vincent and the Grenadines | 0.0 /100 | #332 | Tragic 40.1% |
| Yup'ik | 0.0 /100 | #333 | Tragic 39.9% |
| Puerto Ricans | 0.0 /100 | #334 | Tragic 39.9% |
| Lumbee | 0.0 /100 | #335 | Tragic 39.8% |
| British West Indians | 0.0 /100 | #336 | Tragic 39.8% |
| Blacks/African Americans | 0.0 /100 | #337 | Tragic 39.6% |
| Cape Verdeans | 0.0 /100 | #338 | Tragic 39.6% |
| Dominicans | 0.0 /100 | #339 | Tragic 39.5% |
| Immigrants | Grenada | 0.0 /100 | #340 | Tragic 39.1% |