Israeli vs Crow Married-couple Households
COMPARE
Israeli
Crow
Married-couple Households
Married-couple Households Comparison
Israelis
Crow
46.7%
MARRIED-COUPLE HOUSEHOLDS
62.3/ 100
METRIC RATING
168th/ 347
METRIC RANK
41.4%
MARRIED-COUPLE HOUSEHOLDS
0.0/ 100
METRIC RATING
308th/ 347
METRIC RANK
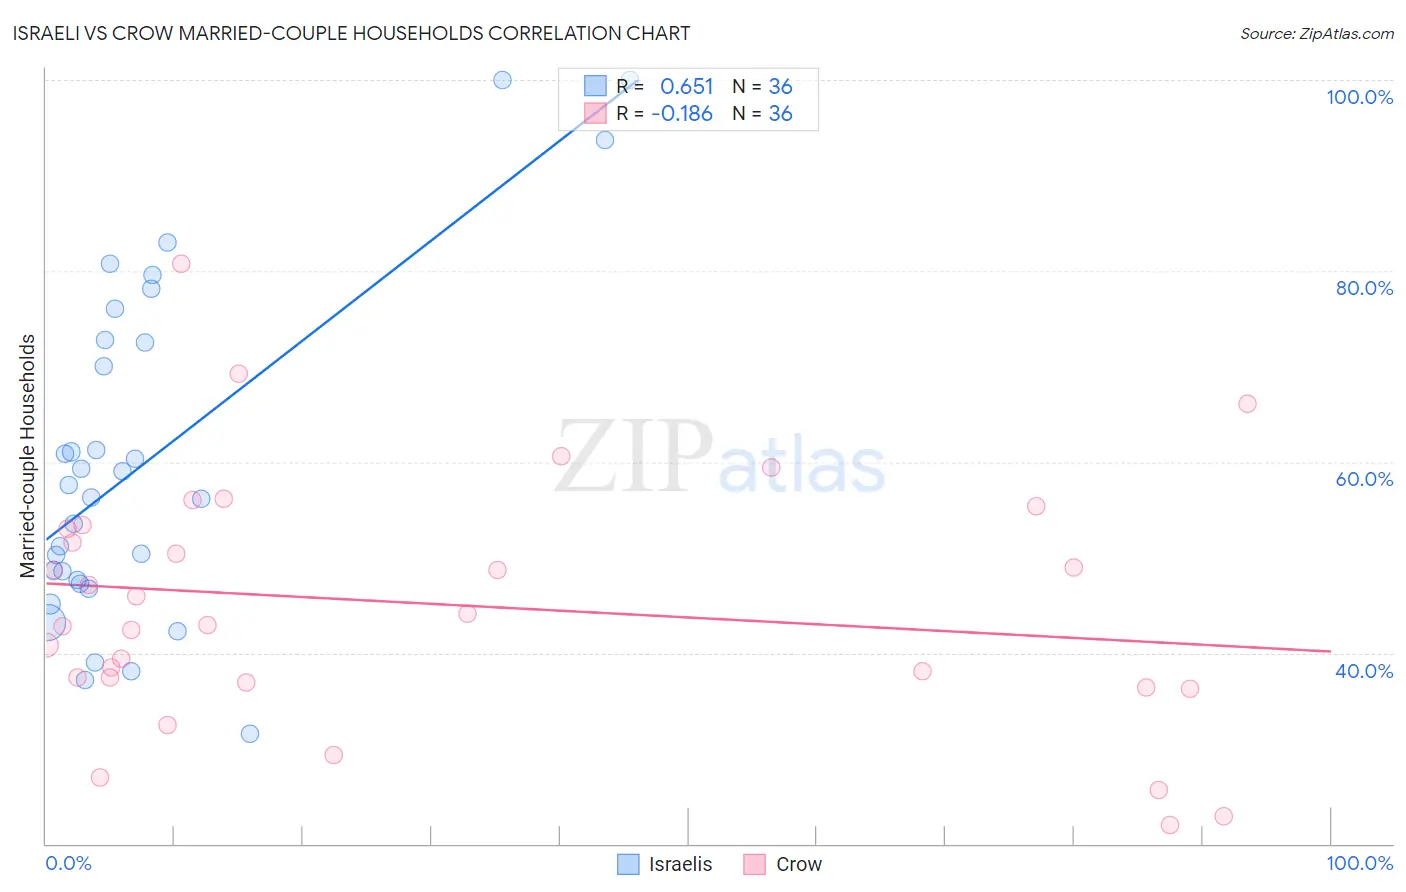
Israeli vs Crow Married-couple Households Correlation Chart
The statistical analysis conducted on geographies consisting of 210,993,217 people shows a significant positive correlation between the proportion of Israelis and percentage of married-couple family households in the United States with a correlation coefficient (R) of 0.651 and weighted average of 46.7%. Similarly, the statistical analysis conducted on geographies consisting of 59,202,817 people shows a poor negative correlation between the proportion of Crow and percentage of married-couple family households in the United States with a correlation coefficient (R) of -0.186 and weighted average of 41.4%, a difference of 12.8%.
Married-couple Households Correlation Summary
| Measurement | Israeli | Crow |
| Minimum | 31.6% | 21.9% |
| Maximum | 100.0% | 80.8% |
| Range | 68.4% | 58.9% |
| Mean | 60.0% | 45.1% |
| Median | 57.0% | 43.5% |
| Interquartile 25% (IQ1) | 47.5% | 37.1% |
| Interquartile 75% (IQ3) | 72.7% | 53.2% |
| Interquartile Range (IQR) | 25.2% | 16.0% |
| Standard Deviation (Sample) | 17.6% | 13.1% |
| Standard Deviation (Population) | 17.4% | 12.9% |
Similar Demographics by Married-couple Households
Demographics Similar to Israelis by Married-couple Households
In terms of married-couple households, the demographic groups most similar to Israelis are Immigrants from Croatia (46.7%, a difference of 0.080%), Spanish American Indian (46.6%, a difference of 0.11%), Cherokee (46.7%, a difference of 0.14%), South American (46.6%, a difference of 0.17%), and Immigrants from Chile (46.5%, a difference of 0.25%).
| Demographics | Rating | Rank | Married-couple Households |
| Delaware | 71.2 /100 | #161 | Good 46.8% |
| Colombians | 71.0 /100 | #162 | Good 46.8% |
| Immigrants | Turkey | 70.2 /100 | #163 | Good 46.8% |
| Immigrants | Kazakhstan | 70.0 /100 | #164 | Good 46.8% |
| Immigrants | Southern Europe | 69.9 /100 | #165 | Good 46.8% |
| Cherokee | 65.7 /100 | #166 | Good 46.7% |
| Immigrants | Croatia | 64.2 /100 | #167 | Good 46.7% |
| Israelis | 62.3 /100 | #168 | Good 46.7% |
| Spanish American Indians | 59.4 /100 | #169 | Average 46.6% |
| South Americans | 58.0 /100 | #170 | Average 46.6% |
| Immigrants | Chile | 55.7 /100 | #171 | Average 46.5% |
| Immigrants | Australia | 54.6 /100 | #172 | Average 46.5% |
| Immigrants | Norway | 52.0 /100 | #173 | Average 46.5% |
| Immigrants | Mexico | 50.0 /100 | #174 | Average 46.4% |
| Immigrants | Colombia | 46.1 /100 | #175 | Average 46.4% |
Demographics Similar to Crow by Married-couple Households
In terms of married-couple households, the demographic groups most similar to Crow are Guyanese (41.4%, a difference of 0.010%), Immigrants from Western Africa (41.4%, a difference of 0.010%), Immigrants from Trinidad and Tobago (41.2%, a difference of 0.35%), Sioux (41.5%, a difference of 0.38%), and Haitian (41.2%, a difference of 0.42%).
| Demographics | Rating | Rank | Married-couple Households |
| Immigrants | Bahamas | 0.0 /100 | #301 | Tragic 41.7% |
| Immigrants | Honduras | 0.0 /100 | #302 | Tragic 41.6% |
| Sub-Saharan Africans | 0.0 /100 | #303 | Tragic 41.6% |
| Immigrants | Guyana | 0.0 /100 | #304 | Tragic 41.6% |
| Sioux | 0.0 /100 | #305 | Tragic 41.5% |
| Guyanese | 0.0 /100 | #306 | Tragic 41.4% |
| Immigrants | Western Africa | 0.0 /100 | #307 | Tragic 41.4% |
| Crow | 0.0 /100 | #308 | Tragic 41.4% |
| Immigrants | Trinidad and Tobago | 0.0 /100 | #309 | Tragic 41.2% |
| Haitians | 0.0 /100 | #310 | Tragic 41.2% |
| Colville | 0.0 /100 | #311 | Tragic 41.0% |
| Africans | 0.0 /100 | #312 | Tragic 40.9% |
| Immigrants | Haiti | 0.0 /100 | #313 | Tragic 40.9% |
| Jamaicans | 0.0 /100 | #314 | Tragic 40.9% |
| Trinidadians and Tobagonians | 0.0 /100 | #315 | Tragic 40.9% |