Immigrants from Fiji vs Crow Married-couple Households
COMPARE
Immigrants from Fiji
Crow
Married-couple Households
Married-couple Households Comparison
Immigrants from Fiji
Crow
48.2%
MARRIED-COUPLE HOUSEHOLDS
98.4/ 100
METRIC RATING
76th/ 347
METRIC RANK
41.4%
MARRIED-COUPLE HOUSEHOLDS
0.0/ 100
METRIC RATING
308th/ 347
METRIC RANK
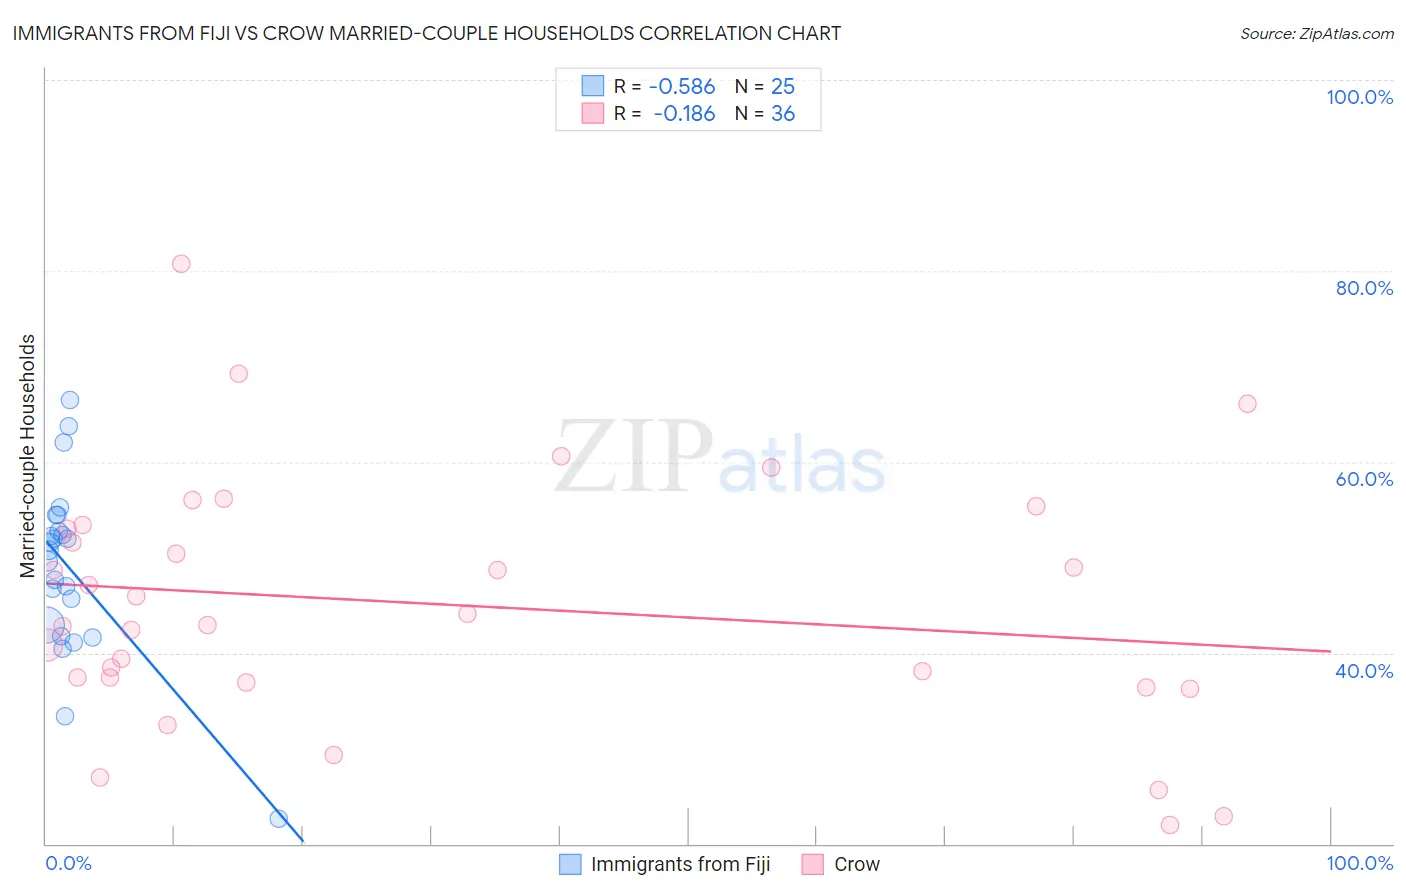
Immigrants from Fiji vs Crow Married-couple Households Correlation Chart
The statistical analysis conducted on geographies consisting of 93,754,900 people shows a substantial negative correlation between the proportion of Immigrants from Fiji and percentage of married-couple family households in the United States with a correlation coefficient (R) of -0.586 and weighted average of 48.2%. Similarly, the statistical analysis conducted on geographies consisting of 59,202,817 people shows a poor negative correlation between the proportion of Crow and percentage of married-couple family households in the United States with a correlation coefficient (R) of -0.186 and weighted average of 41.4%, a difference of 16.7%.
Married-couple Households Correlation Summary
| Measurement | Immigrants from Fiji | Crow |
| Minimum | 22.7% | 21.9% |
| Maximum | 66.5% | 80.8% |
| Range | 43.8% | 58.9% |
| Mean | 48.8% | 45.1% |
| Median | 50.7% | 43.5% |
| Interquartile 25% (IQ1) | 42.3% | 37.1% |
| Interquartile 75% (IQ3) | 53.6% | 53.2% |
| Interquartile Range (IQR) | 11.2% | 16.0% |
| Standard Deviation (Sample) | 9.3% | 13.1% |
| Standard Deviation (Population) | 9.1% | 12.9% |
Similar Demographics by Married-couple Households
Demographics Similar to Immigrants from Fiji by Married-couple Households
In terms of married-couple households, the demographic groups most similar to Immigrants from Fiji are Immigrants from England (48.2%, a difference of 0.0%), Immigrants from Romania (48.3%, a difference of 0.090%), Immigrants from Singapore (48.3%, a difference of 0.10%), Canadian (48.2%, a difference of 0.10%), and Egyptian (48.2%, a difference of 0.12%).
| Demographics | Rating | Rank | Married-couple Households |
| Immigrants | China | 98.9 /100 | #69 | Exceptional 48.4% |
| Immigrants | North America | 98.9 /100 | #70 | Exceptional 48.4% |
| Laotians | 98.8 /100 | #71 | Exceptional 48.4% |
| Scotch-Irish | 98.6 /100 | #72 | Exceptional 48.3% |
| Immigrants | Singapore | 98.6 /100 | #73 | Exceptional 48.3% |
| Immigrants | Romania | 98.6 /100 | #74 | Exceptional 48.3% |
| Immigrants | England | 98.4 /100 | #75 | Exceptional 48.2% |
| Immigrants | Fiji | 98.4 /100 | #76 | Exceptional 48.2% |
| Canadians | 98.2 /100 | #77 | Exceptional 48.2% |
| Egyptians | 98.2 /100 | #78 | Exceptional 48.2% |
| Immigrants | Netherlands | 98.2 /100 | #79 | Exceptional 48.2% |
| Russians | 98.1 /100 | #80 | Exceptional 48.2% |
| Finns | 98.0 /100 | #81 | Exceptional 48.1% |
| Immigrants | Poland | 97.7 /100 | #82 | Exceptional 48.1% |
| Guamanians/Chamorros | 97.6 /100 | #83 | Exceptional 48.1% |
Demographics Similar to Crow by Married-couple Households
In terms of married-couple households, the demographic groups most similar to Crow are Guyanese (41.4%, a difference of 0.010%), Immigrants from Western Africa (41.4%, a difference of 0.010%), Immigrants from Trinidad and Tobago (41.2%, a difference of 0.35%), Sioux (41.5%, a difference of 0.38%), and Haitian (41.2%, a difference of 0.42%).
| Demographics | Rating | Rank | Married-couple Households |
| Immigrants | Bahamas | 0.0 /100 | #301 | Tragic 41.7% |
| Immigrants | Honduras | 0.0 /100 | #302 | Tragic 41.6% |
| Sub-Saharan Africans | 0.0 /100 | #303 | Tragic 41.6% |
| Immigrants | Guyana | 0.0 /100 | #304 | Tragic 41.6% |
| Sioux | 0.0 /100 | #305 | Tragic 41.5% |
| Guyanese | 0.0 /100 | #306 | Tragic 41.4% |
| Immigrants | Western Africa | 0.0 /100 | #307 | Tragic 41.4% |
| Crow | 0.0 /100 | #308 | Tragic 41.4% |
| Immigrants | Trinidad and Tobago | 0.0 /100 | #309 | Tragic 41.2% |
| Haitians | 0.0 /100 | #310 | Tragic 41.2% |
| Colville | 0.0 /100 | #311 | Tragic 41.0% |
| Africans | 0.0 /100 | #312 | Tragic 40.9% |
| Immigrants | Haiti | 0.0 /100 | #313 | Tragic 40.9% |
| Jamaicans | 0.0 /100 | #314 | Tragic 40.9% |
| Trinidadians and Tobagonians | 0.0 /100 | #315 | Tragic 40.9% |