Israeli vs Immigrants from Cabo Verde Married-couple Households
COMPARE
Israeli
Immigrants from Cabo Verde
Married-couple Households
Married-couple Households Comparison
Israelis
Immigrants from Cabo Verde
46.7%
MARRIED-COUPLE HOUSEHOLDS
62.3/ 100
METRIC RATING
168th/ 347
METRIC RANK
36.2%
MARRIED-COUPLE HOUSEHOLDS
0.0/ 100
METRIC RATING
346th/ 347
METRIC RANK
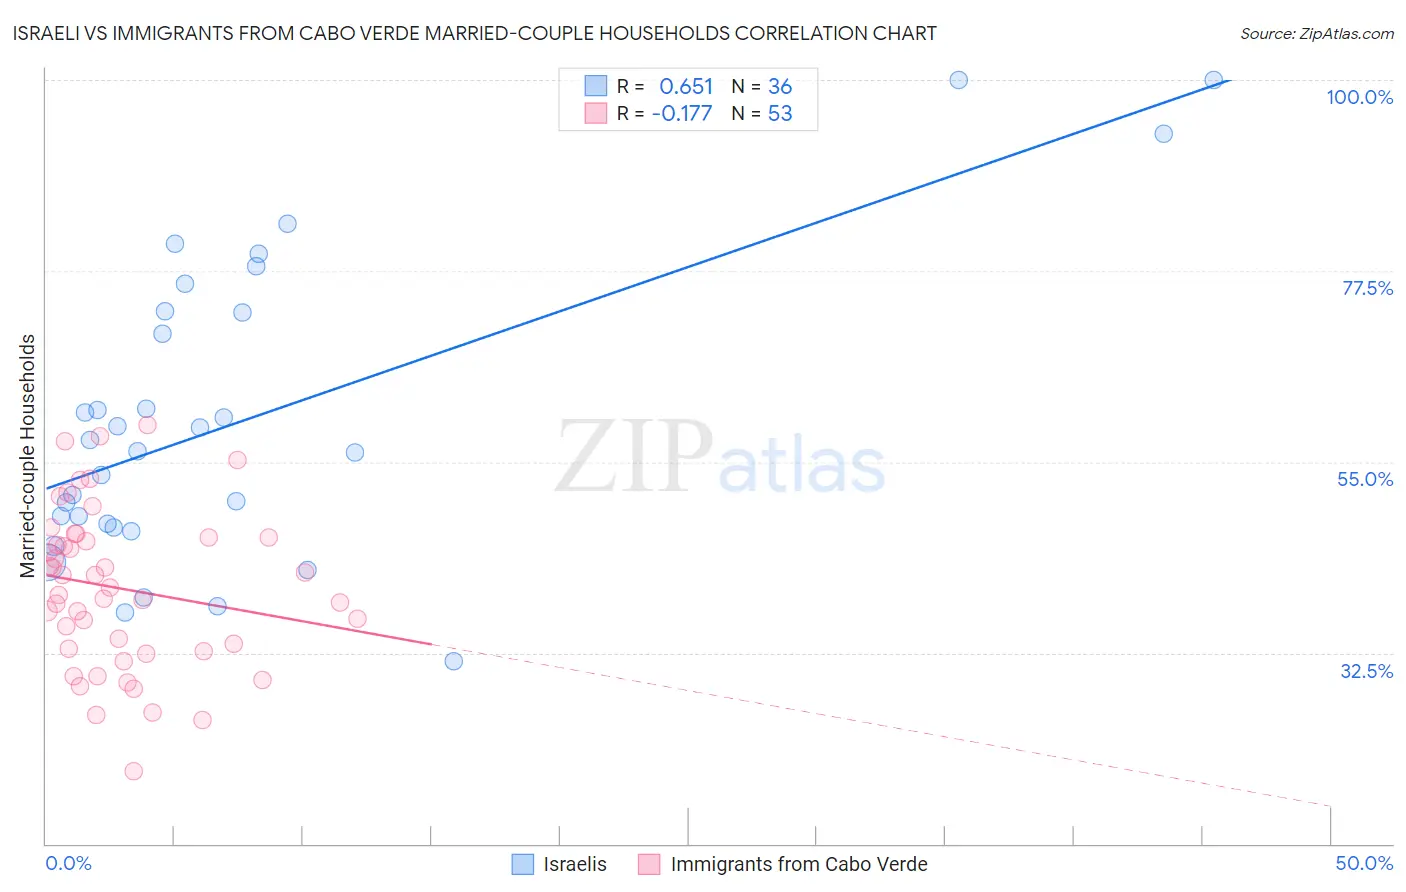
Israeli vs Immigrants from Cabo Verde Married-couple Households Correlation Chart
The statistical analysis conducted on geographies consisting of 210,993,217 people shows a significant positive correlation between the proportion of Israelis and percentage of married-couple family households in the United States with a correlation coefficient (R) of 0.651 and weighted average of 46.7%. Similarly, the statistical analysis conducted on geographies consisting of 38,131,070 people shows a poor negative correlation between the proportion of Immigrants from Cabo Verde and percentage of married-couple family households in the United States with a correlation coefficient (R) of -0.177 and weighted average of 36.2%, a difference of 28.8%.
Married-couple Households Correlation Summary
| Measurement | Israeli | Immigrants from Cabo Verde |
| Minimum | 31.6% | 18.5% |
| Maximum | 100.0% | 59.3% |
| Range | 68.4% | 40.8% |
| Mean | 60.0% | 40.1% |
| Median | 57.0% | 40.1% |
| Interquartile 25% (IQ1) | 47.5% | 32.9% |
| Interquartile 75% (IQ3) | 72.7% | 46.1% |
| Interquartile Range (IQR) | 25.2% | 13.2% |
| Standard Deviation (Sample) | 17.6% | 9.3% |
| Standard Deviation (Population) | 17.4% | 9.2% |
Similar Demographics by Married-couple Households
Demographics Similar to Israelis by Married-couple Households
In terms of married-couple households, the demographic groups most similar to Israelis are Immigrants from Croatia (46.7%, a difference of 0.080%), Spanish American Indian (46.6%, a difference of 0.11%), Cherokee (46.7%, a difference of 0.14%), South American (46.6%, a difference of 0.17%), and Immigrants from Chile (46.5%, a difference of 0.25%).
| Demographics | Rating | Rank | Married-couple Households |
| Delaware | 71.2 /100 | #161 | Good 46.8% |
| Colombians | 71.0 /100 | #162 | Good 46.8% |
| Immigrants | Turkey | 70.2 /100 | #163 | Good 46.8% |
| Immigrants | Kazakhstan | 70.0 /100 | #164 | Good 46.8% |
| Immigrants | Southern Europe | 69.9 /100 | #165 | Good 46.8% |
| Cherokee | 65.7 /100 | #166 | Good 46.7% |
| Immigrants | Croatia | 64.2 /100 | #167 | Good 46.7% |
| Israelis | 62.3 /100 | #168 | Good 46.7% |
| Spanish American Indians | 59.4 /100 | #169 | Average 46.6% |
| South Americans | 58.0 /100 | #170 | Average 46.6% |
| Immigrants | Chile | 55.7 /100 | #171 | Average 46.5% |
| Immigrants | Australia | 54.6 /100 | #172 | Average 46.5% |
| Immigrants | Norway | 52.0 /100 | #173 | Average 46.5% |
| Immigrants | Mexico | 50.0 /100 | #174 | Average 46.4% |
| Immigrants | Colombia | 46.1 /100 | #175 | Average 46.4% |
Demographics Similar to Immigrants from Cabo Verde by Married-couple Households
In terms of married-couple households, the demographic groups most similar to Immigrants from Cabo Verde are Hopi (36.7%, a difference of 1.2%), Pima (35.6%, a difference of 1.9%), Immigrants from Dominican Republic (37.3%, a difference of 3.0%), Immigrants from Grenada (37.5%, a difference of 3.5%), and Tohono O'odham (37.9%, a difference of 4.6%).
| Demographics | Rating | Rank | Married-couple Households |
| Immigrants | West Indies | 0.0 /100 | #333 | Tragic 39.0% |
| Immigrants | St. Vincent and the Grenadines | 0.0 /100 | #334 | Tragic 38.7% |
| Senegalese | 0.0 /100 | #335 | Tragic 38.6% |
| Blacks/African Americans | 0.0 /100 | #336 | Tragic 38.5% |
| Immigrants | Somalia | 0.0 /100 | #337 | Tragic 38.4% |
| Immigrants | Senegal | 0.0 /100 | #338 | Tragic 38.4% |
| British West Indians | 0.0 /100 | #339 | Tragic 38.3% |
| Dominicans | 0.0 /100 | #340 | Tragic 38.2% |
| Cape Verdeans | 0.0 /100 | #341 | Tragic 38.1% |
| Tohono O'odham | 0.0 /100 | #342 | Tragic 37.9% |
| Immigrants | Grenada | 0.0 /100 | #343 | Tragic 37.5% |
| Immigrants | Dominican Republic | 0.0 /100 | #344 | Tragic 37.3% |
| Hopi | 0.0 /100 | #345 | Tragic 36.7% |
| Immigrants | Cabo Verde | 0.0 /100 | #346 | Tragic 36.2% |
| Pima | 0.0 /100 | #347 | Tragic 35.6% |