Blackfeet vs Crow Married-couple Households
COMPARE
Blackfeet
Crow
Married-couple Households
Married-couple Households Comparison
Blackfeet
Crow
43.8%
MARRIED-COUPLE HOUSEHOLDS
0.2/ 100
METRIC RATING
257th/ 347
METRIC RANK
41.4%
MARRIED-COUPLE HOUSEHOLDS
0.0/ 100
METRIC RATING
308th/ 347
METRIC RANK
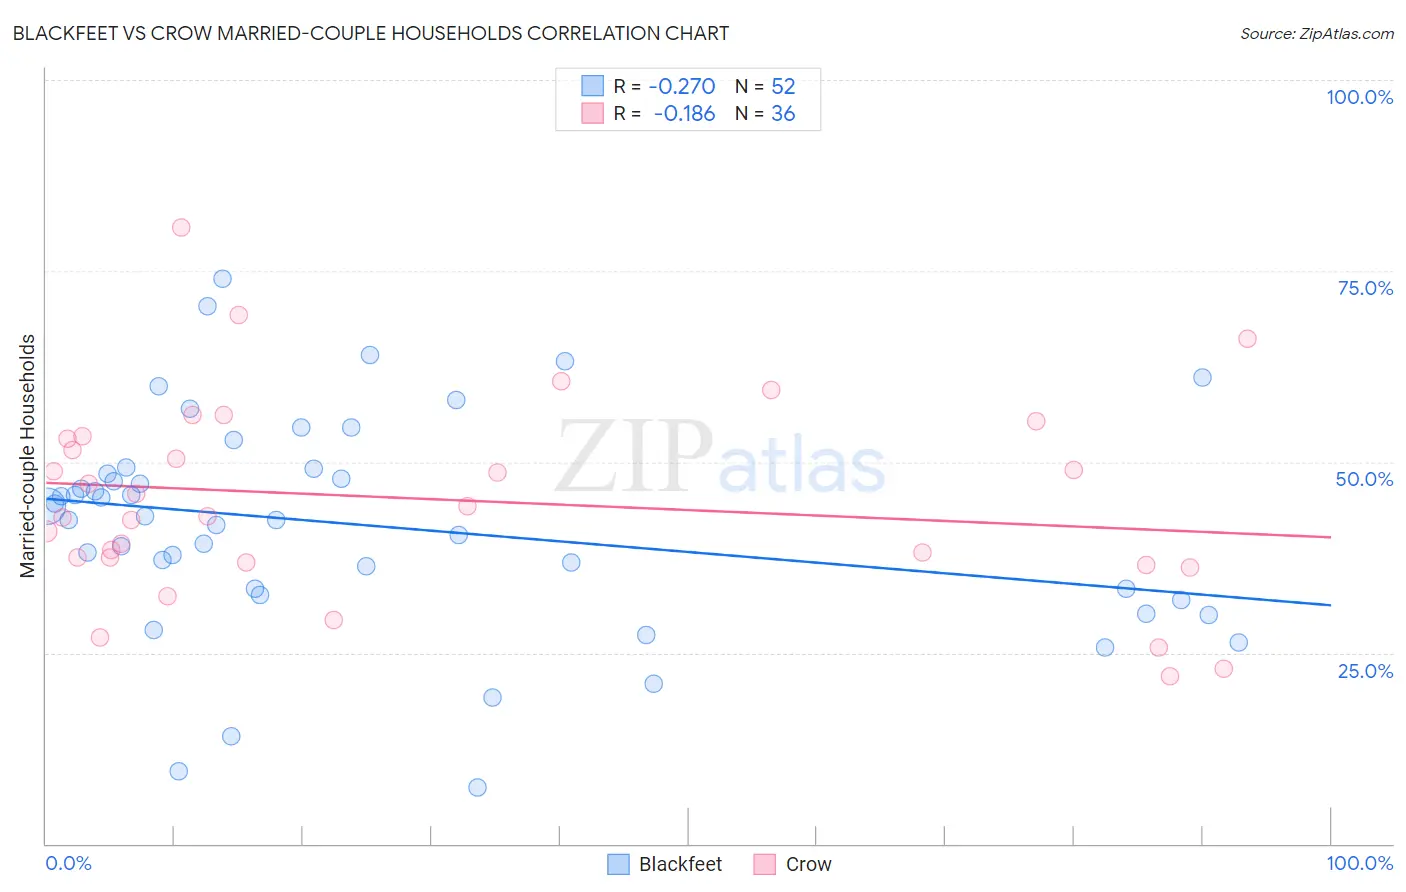
Blackfeet vs Crow Married-couple Households Correlation Chart
The statistical analysis conducted on geographies consisting of 309,469,352 people shows a weak negative correlation between the proportion of Blackfeet and percentage of married-couple family households in the United States with a correlation coefficient (R) of -0.270 and weighted average of 43.8%. Similarly, the statistical analysis conducted on geographies consisting of 59,202,817 people shows a poor negative correlation between the proportion of Crow and percentage of married-couple family households in the United States with a correlation coefficient (R) of -0.186 and weighted average of 41.4%, a difference of 5.9%.
Married-couple Households Correlation Summary
| Measurement | Blackfeet | Crow |
| Minimum | 7.3% | 21.9% |
| Maximum | 74.0% | 80.8% |
| Range | 66.7% | 58.9% |
| Mean | 41.7% | 45.1% |
| Median | 42.7% | 43.5% |
| Interquartile 25% (IQ1) | 33.0% | 37.1% |
| Interquartile 75% (IQ3) | 48.8% | 53.2% |
| Interquartile Range (IQR) | 15.8% | 16.0% |
| Standard Deviation (Sample) | 14.3% | 13.1% |
| Standard Deviation (Population) | 14.1% | 12.9% |
Similar Demographics by Married-couple Households
Demographics Similar to Blackfeet by Married-couple Households
In terms of married-couple households, the demographic groups most similar to Blackfeet are Central American Indian (43.8%, a difference of 0.040%), Iroquois (43.7%, a difference of 0.070%), Immigrants from Cameroon (43.7%, a difference of 0.15%), Ugandan (43.8%, a difference of 0.16%), and Alaskan Athabascan (43.6%, a difference of 0.28%).
| Demographics | Rating | Rank | Married-couple Households |
| French American Indians | 0.4 /100 | #250 | Tragic 44.1% |
| German Russians | 0.4 /100 | #251 | Tragic 44.0% |
| Seminole | 0.4 /100 | #252 | Tragic 44.0% |
| Central Americans | 0.3 /100 | #253 | Tragic 43.9% |
| Apache | 0.3 /100 | #254 | Tragic 43.9% |
| Shoshone | 0.3 /100 | #255 | Tragic 43.9% |
| Ugandans | 0.3 /100 | #256 | Tragic 43.8% |
| Blackfeet | 0.2 /100 | #257 | Tragic 43.8% |
| Central American Indians | 0.2 /100 | #258 | Tragic 43.8% |
| Iroquois | 0.2 /100 | #259 | Tragic 43.7% |
| Immigrants | Cameroon | 0.2 /100 | #260 | Tragic 43.7% |
| Alaskan Athabascans | 0.2 /100 | #261 | Tragic 43.6% |
| Vietnamese | 0.2 /100 | #262 | Tragic 43.6% |
| Cree | 0.1 /100 | #263 | Tragic 43.6% |
| Bangladeshis | 0.1 /100 | #264 | Tragic 43.5% |
Demographics Similar to Crow by Married-couple Households
In terms of married-couple households, the demographic groups most similar to Crow are Guyanese (41.4%, a difference of 0.010%), Immigrants from Western Africa (41.4%, a difference of 0.010%), Immigrants from Trinidad and Tobago (41.2%, a difference of 0.35%), Sioux (41.5%, a difference of 0.38%), and Haitian (41.2%, a difference of 0.42%).
| Demographics | Rating | Rank | Married-couple Households |
| Immigrants | Bahamas | 0.0 /100 | #301 | Tragic 41.7% |
| Immigrants | Honduras | 0.0 /100 | #302 | Tragic 41.6% |
| Sub-Saharan Africans | 0.0 /100 | #303 | Tragic 41.6% |
| Immigrants | Guyana | 0.0 /100 | #304 | Tragic 41.6% |
| Sioux | 0.0 /100 | #305 | Tragic 41.5% |
| Guyanese | 0.0 /100 | #306 | Tragic 41.4% |
| Immigrants | Western Africa | 0.0 /100 | #307 | Tragic 41.4% |
| Crow | 0.0 /100 | #308 | Tragic 41.4% |
| Immigrants | Trinidad and Tobago | 0.0 /100 | #309 | Tragic 41.2% |
| Haitians | 0.0 /100 | #310 | Tragic 41.2% |
| Colville | 0.0 /100 | #311 | Tragic 41.0% |
| Africans | 0.0 /100 | #312 | Tragic 40.9% |
| Immigrants | Haiti | 0.0 /100 | #313 | Tragic 40.9% |
| Jamaicans | 0.0 /100 | #314 | Tragic 40.9% |
| Trinidadians and Tobagonians | 0.0 /100 | #315 | Tragic 40.9% |