Immigrants from Zaire vs Syrian Family Households
COMPARE
Immigrants from Zaire
Syrian
Family Households
Family Households Comparison
Immigrants from Zaire
Syrians
59.2%
FAMILY HOUSEHOLDS
0.0/ 100
METRIC RATING
345th/ 347
METRIC RANK
64.5%
FAMILY HOUSEHOLDS
75.2/ 100
METRIC RATING
151st/ 347
METRIC RANK
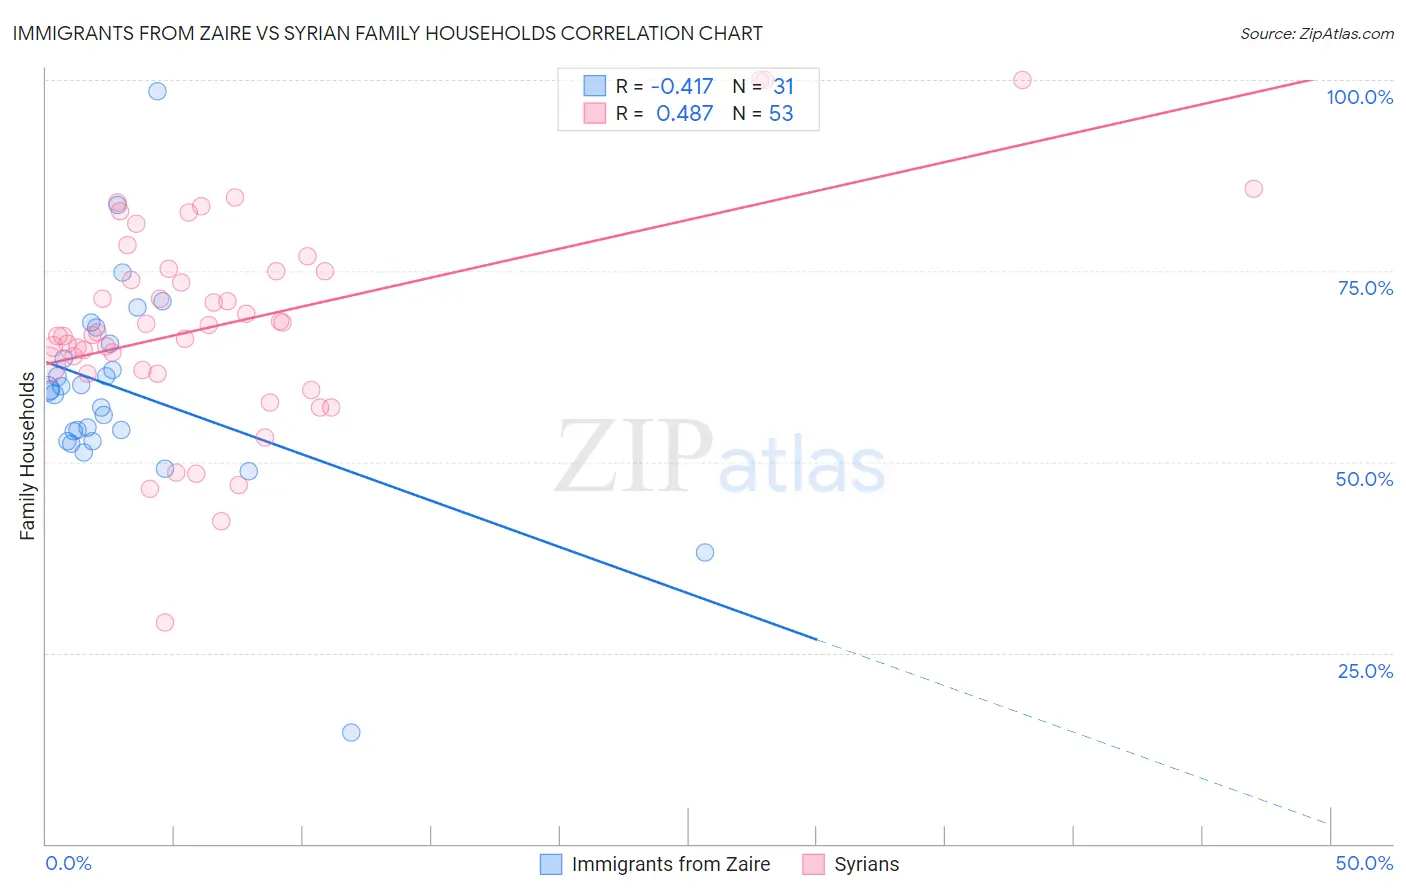
Immigrants from Zaire vs Syrian Family Households Correlation Chart
The statistical analysis conducted on geographies consisting of 107,246,225 people shows a moderate negative correlation between the proportion of Immigrants from Zaire and percentage of family households in the United States with a correlation coefficient (R) of -0.417 and weighted average of 59.2%. Similarly, the statistical analysis conducted on geographies consisting of 266,181,919 people shows a moderate positive correlation between the proportion of Syrians and percentage of family households in the United States with a correlation coefficient (R) of 0.487 and weighted average of 64.5%, a difference of 9.1%.
Family Households Correlation Summary
| Measurement | Immigrants from Zaire | Syrian |
| Minimum | 14.5% | 29.0% |
| Maximum | 98.6% | 100.0% |
| Range | 84.1% | 71.0% |
| Mean | 59.2% | 68.3% |
| Median | 59.4% | 66.9% |
| Interquartile 25% (IQ1) | 52.7% | 61.8% |
| Interquartile 75% (IQ3) | 65.5% | 75.2% |
| Interquartile Range (IQR) | 12.8% | 13.4% |
| Standard Deviation (Sample) | 14.0% | 13.8% |
| Standard Deviation (Population) | 13.7% | 13.7% |
Similar Demographics by Family Households
Demographics Similar to Immigrants from Zaire by Family Households
In terms of family households, the demographic groups most similar to Immigrants from Zaire are Immigrants from Congo (59.2%, a difference of 0.14%), Senegalese (59.8%, a difference of 1.1%), Sudanese (60.0%, a difference of 1.4%), Immigrants from Senegal (60.1%, a difference of 1.6%), and Immigrants from Sudan (60.2%, a difference of 1.7%).
| Demographics | Rating | Rank | Family Households |
| Immigrants | Ethiopia | 0.0 /100 | #333 | Tragic 61.2% |
| Immigrants | Eastern Africa | 0.0 /100 | #334 | Tragic 61.1% |
| Carpatho Rusyns | 0.0 /100 | #335 | Tragic 61.1% |
| German Russians | 0.0 /100 | #336 | Tragic 60.9% |
| Soviet Union | 0.0 /100 | #337 | Tragic 60.9% |
| Immigrants | Eritrea | 0.0 /100 | #338 | Tragic 60.8% |
| Immigrants | Saudi Arabia | 0.0 /100 | #339 | Tragic 60.7% |
| Immigrants | Sudan | 0.0 /100 | #340 | Tragic 60.2% |
| Immigrants | Senegal | 0.0 /100 | #341 | Tragic 60.1% |
| Sudanese | 0.0 /100 | #342 | Tragic 60.0% |
| Senegalese | 0.0 /100 | #343 | Tragic 59.8% |
| Immigrants | Congo | 0.0 /100 | #344 | Tragic 59.2% |
| Immigrants | Zaire | 0.0 /100 | #345 | Tragic 59.2% |
| Somalis | 0.0 /100 | #346 | Tragic 57.6% |
| Immigrants | Somalia | 0.0 /100 | #347 | Tragic 56.7% |
Demographics Similar to Syrians by Family Households
In terms of family households, the demographic groups most similar to Syrians are Romanian (64.5%, a difference of 0.0%), Immigrants from Chile (64.6%, a difference of 0.020%), Delaware (64.6%, a difference of 0.020%), Sioux (64.6%, a difference of 0.020%), and Immigrants from Romania (64.6%, a difference of 0.030%).
| Demographics | Rating | Rank | Family Households |
| South American Indians | 81.9 /100 | #144 | Excellent 64.6% |
| Welsh | 80.1 /100 | #145 | Excellent 64.6% |
| Immigrants | Romania | 77.0 /100 | #146 | Good 64.6% |
| Immigrants | Chile | 76.5 /100 | #147 | Good 64.6% |
| Delaware | 76.3 /100 | #148 | Good 64.6% |
| Sioux | 76.3 /100 | #149 | Good 64.6% |
| Romanians | 75.3 /100 | #150 | Good 64.5% |
| Syrians | 75.2 /100 | #151 | Good 64.5% |
| Scottish | 70.9 /100 | #152 | Good 64.5% |
| Swedes | 69.8 /100 | #153 | Good 64.5% |
| Austrians | 68.5 /100 | #154 | Good 64.5% |
| Uruguayans | 67.7 /100 | #155 | Good 64.5% |
| Czechs | 67.0 /100 | #156 | Good 64.5% |
| Canadians | 66.6 /100 | #157 | Good 64.4% |
| Lebanese | 66.4 /100 | #158 | Good 64.4% |