Immigrants from Zaire vs Immigrants from India Family Households
COMPARE
Immigrants from Zaire
Immigrants from India
Family Households
Family Households Comparison
Immigrants from Zaire
Immigrants from India
59.2%
FAMILY HOUSEHOLDS
0.0/ 100
METRIC RATING
345th/ 347
METRIC RANK
67.4%
FAMILY HOUSEHOLDS
100.0/ 100
METRIC RATING
26th/ 347
METRIC RANK
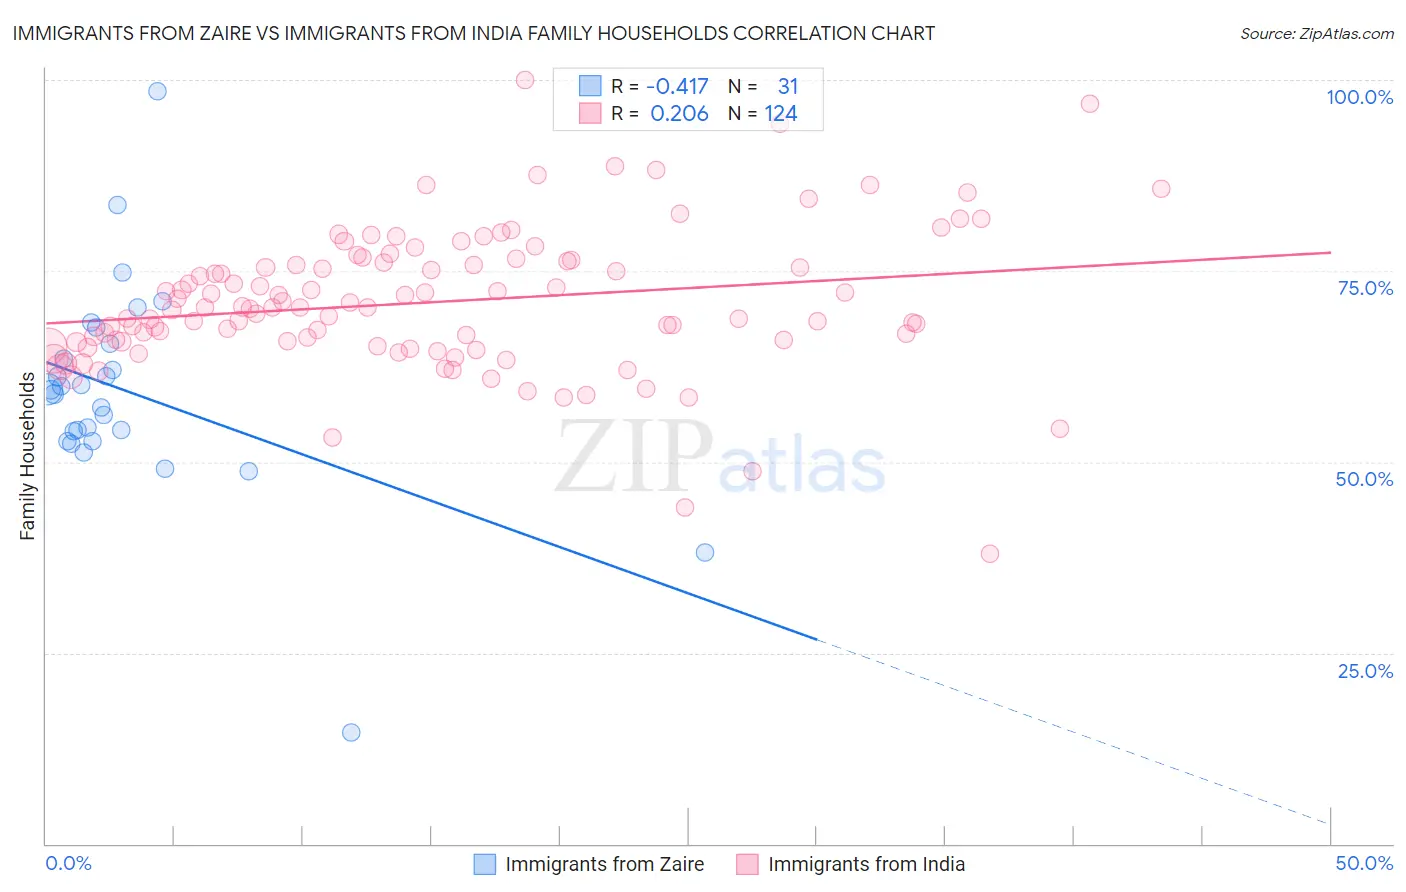
Immigrants from Zaire vs Immigrants from India Family Households Correlation Chart
The statistical analysis conducted on geographies consisting of 107,246,225 people shows a moderate negative correlation between the proportion of Immigrants from Zaire and percentage of family households in the United States with a correlation coefficient (R) of -0.417 and weighted average of 59.2%. Similarly, the statistical analysis conducted on geographies consisting of 433,768,337 people shows a weak positive correlation between the proportion of Immigrants from India and percentage of family households in the United States with a correlation coefficient (R) of 0.206 and weighted average of 67.4%, a difference of 14.0%.
Family Households Correlation Summary
| Measurement | Immigrants from Zaire | Immigrants from India |
| Minimum | 14.5% | 37.9% |
| Maximum | 98.6% | 100.0% |
| Range | 84.1% | 62.1% |
| Mean | 59.2% | 70.9% |
| Median | 59.4% | 70.2% |
| Interquartile 25% (IQ1) | 52.7% | 65.7% |
| Interquartile 75% (IQ3) | 65.5% | 76.1% |
| Interquartile Range (IQR) | 12.8% | 10.4% |
| Standard Deviation (Sample) | 14.0% | 9.4% |
| Standard Deviation (Population) | 13.7% | 9.4% |
Similar Demographics by Family Households
Demographics Similar to Immigrants from Zaire by Family Households
In terms of family households, the demographic groups most similar to Immigrants from Zaire are Immigrants from Congo (59.2%, a difference of 0.14%), Senegalese (59.8%, a difference of 1.1%), Sudanese (60.0%, a difference of 1.4%), Immigrants from Senegal (60.1%, a difference of 1.6%), and Immigrants from Sudan (60.2%, a difference of 1.7%).
| Demographics | Rating | Rank | Family Households |
| Immigrants | Ethiopia | 0.0 /100 | #333 | Tragic 61.2% |
| Immigrants | Eastern Africa | 0.0 /100 | #334 | Tragic 61.1% |
| Carpatho Rusyns | 0.0 /100 | #335 | Tragic 61.1% |
| German Russians | 0.0 /100 | #336 | Tragic 60.9% |
| Soviet Union | 0.0 /100 | #337 | Tragic 60.9% |
| Immigrants | Eritrea | 0.0 /100 | #338 | Tragic 60.8% |
| Immigrants | Saudi Arabia | 0.0 /100 | #339 | Tragic 60.7% |
| Immigrants | Sudan | 0.0 /100 | #340 | Tragic 60.2% |
| Immigrants | Senegal | 0.0 /100 | #341 | Tragic 60.1% |
| Sudanese | 0.0 /100 | #342 | Tragic 60.0% |
| Senegalese | 0.0 /100 | #343 | Tragic 59.8% |
| Immigrants | Congo | 0.0 /100 | #344 | Tragic 59.2% |
| Immigrants | Zaire | 0.0 /100 | #345 | Tragic 59.2% |
| Somalis | 0.0 /100 | #346 | Tragic 57.6% |
| Immigrants | Somalia | 0.0 /100 | #347 | Tragic 56.7% |
Demographics Similar to Immigrants from India by Family Households
In terms of family households, the demographic groups most similar to Immigrants from India are Immigrants from Nicaragua (67.5%, a difference of 0.010%), Immigrants from South Eastern Asia (67.5%, a difference of 0.040%), Hispanic or Latino (67.4%, a difference of 0.040%), Hawaiian (67.4%, a difference of 0.060%), and Nicaraguan (67.4%, a difference of 0.13%).
| Demographics | Rating | Rank | Family Households |
| Samoans | 100.0 /100 | #19 | Exceptional 67.9% |
| Inupiat | 100.0 /100 | #20 | Exceptional 67.8% |
| Cubans | 100.0 /100 | #21 | Exceptional 67.7% |
| Sri Lankans | 100.0 /100 | #22 | Exceptional 67.7% |
| Immigrants | Pakistan | 100.0 /100 | #23 | Exceptional 67.7% |
| Immigrants | South Eastern Asia | 100.0 /100 | #24 | Exceptional 67.5% |
| Immigrants | Nicaragua | 100.0 /100 | #25 | Exceptional 67.5% |
| Immigrants | India | 100.0 /100 | #26 | Exceptional 67.4% |
| Hispanics or Latinos | 100.0 /100 | #27 | Exceptional 67.4% |
| Hawaiians | 100.0 /100 | #28 | Exceptional 67.4% |
| Nicaraguans | 100.0 /100 | #29 | Exceptional 67.4% |
| Immigrants | Peru | 100.0 /100 | #30 | Exceptional 67.2% |
| Immigrants | Latin America | 100.0 /100 | #31 | Exceptional 67.2% |
| Nepalese | 100.0 /100 | #32 | Exceptional 67.2% |
| Salvadorans | 100.0 /100 | #33 | Exceptional 67.2% |