Immigrants from Scotland vs Immigrants from Latin America Married-couple Households
COMPARE
Immigrants from Scotland
Immigrants from Latin America
Married-couple Households
Married-couple Households Comparison
Immigrants from Scotland
Immigrants from Latin America
49.3%
MARRIED-COUPLE HOUSEHOLDS
99.8/ 100
METRIC RATING
26th/ 347
METRIC RANK
44.7%
MARRIED-COUPLE HOUSEHOLDS
1.6/ 100
METRIC RATING
229th/ 347
METRIC RANK
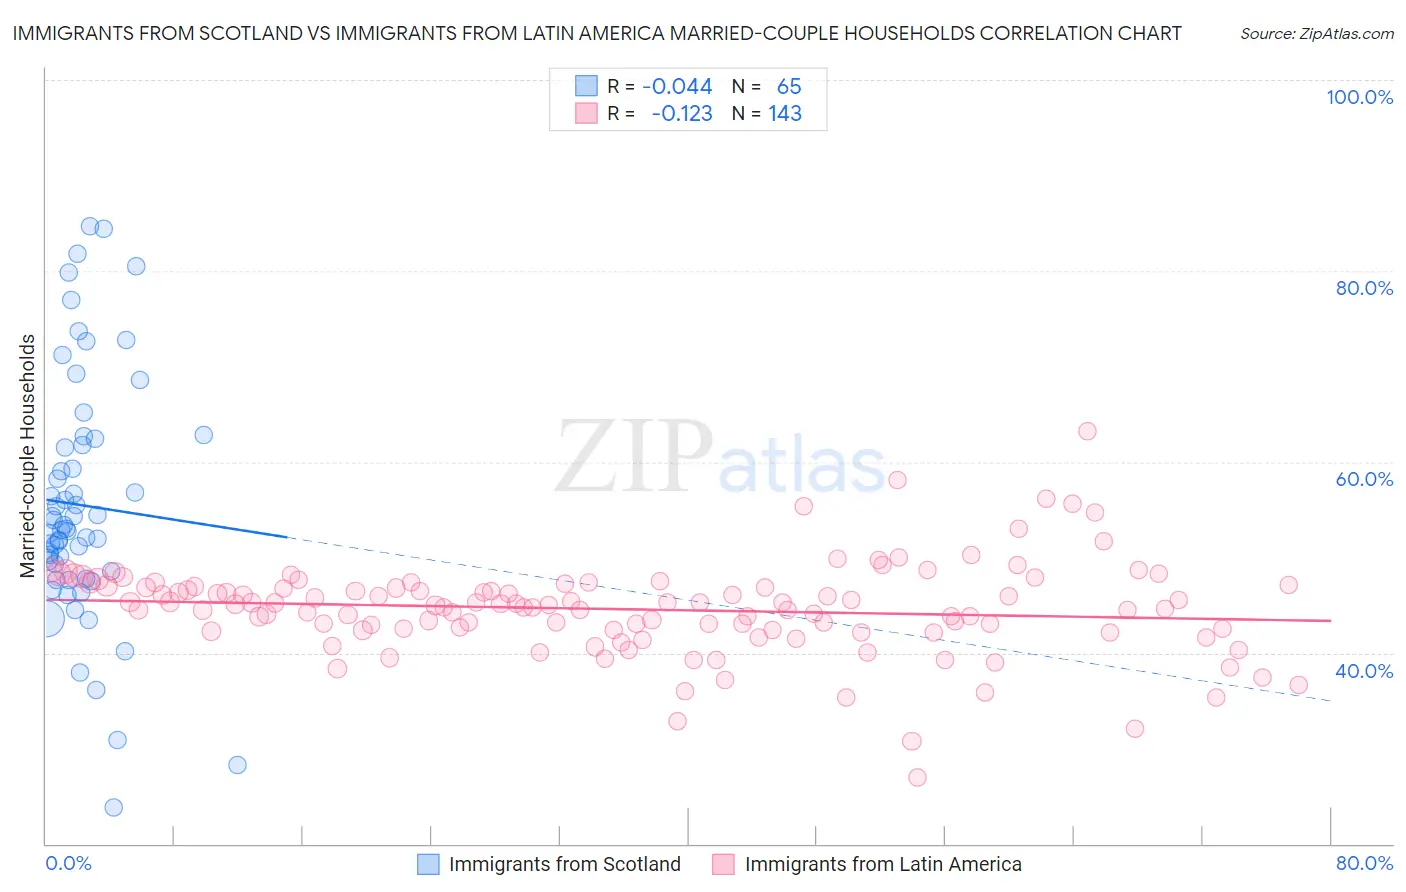
Immigrants from Scotland vs Immigrants from Latin America Married-couple Households Correlation Chart
The statistical analysis conducted on geographies consisting of 196,383,501 people shows no correlation between the proportion of Immigrants from Scotland and percentage of married-couple family households in the United States with a correlation coefficient (R) of -0.044 and weighted average of 49.3%. Similarly, the statistical analysis conducted on geographies consisting of 557,974,846 people shows a poor negative correlation between the proportion of Immigrants from Latin America and percentage of married-couple family households in the United States with a correlation coefficient (R) of -0.123 and weighted average of 44.7%, a difference of 10.3%.
Married-couple Households Correlation Summary
| Measurement | Immigrants from Scotland | Immigrants from Latin America |
| Minimum | 23.8% | 26.9% |
| Maximum | 84.6% | 63.3% |
| Range | 60.9% | 36.4% |
| Mean | 55.5% | 44.6% |
| Median | 53.0% | 45.0% |
| Interquartile 25% (IQ1) | 48.2% | 42.4% |
| Interquartile 75% (IQ3) | 62.1% | 47.0% |
| Interquartile Range (IQR) | 13.9% | 4.7% |
| Standard Deviation (Sample) | 12.8% | 4.9% |
| Standard Deviation (Population) | 12.7% | 4.9% |
Similar Demographics by Married-couple Households
Demographics Similar to Immigrants from Scotland by Married-couple Households
In terms of married-couple households, the demographic groups most similar to Immigrants from Scotland are Bhutanese (49.3%, a difference of 0.020%), Immigrants from Philippines (49.3%, a difference of 0.13%), German (49.2%, a difference of 0.21%), Maltese (49.2%, a difference of 0.22%), and Bolivian (49.2%, a difference of 0.23%).
| Demographics | Rating | Rank | Married-couple Households |
| Europeans | 99.9 /100 | #19 | Exceptional 49.6% |
| Scandinavians | 99.9 /100 | #20 | Exceptional 49.6% |
| Norwegians | 99.9 /100 | #21 | Exceptional 49.5% |
| Asians | 99.9 /100 | #22 | Exceptional 49.5% |
| Dutch | 99.9 /100 | #23 | Exceptional 49.5% |
| Czechs | 99.9 /100 | #24 | Exceptional 49.4% |
| Immigrants | Philippines | 99.9 /100 | #25 | Exceptional 49.3% |
| Immigrants | Scotland | 99.8 /100 | #26 | Exceptional 49.3% |
| Bhutanese | 99.8 /100 | #27 | Exceptional 49.3% |
| Germans | 99.8 /100 | #28 | Exceptional 49.2% |
| Maltese | 99.8 /100 | #29 | Exceptional 49.2% |
| Bolivians | 99.8 /100 | #30 | Exceptional 49.2% |
| Native Hawaiians | 99.8 /100 | #31 | Exceptional 49.1% |
| Hungarians | 99.8 /100 | #32 | Exceptional 49.1% |
| Immigrants | Asia | 99.7 /100 | #33 | Exceptional 49.1% |
Demographics Similar to Immigrants from Latin America by Married-couple Households
In terms of married-couple households, the demographic groups most similar to Immigrants from Latin America are Soviet Union (44.6%, a difference of 0.040%), Kenyan (44.7%, a difference of 0.050%), Houma (44.6%, a difference of 0.050%), Marshallese (44.6%, a difference of 0.050%), and Immigrants from Uganda (44.6%, a difference of 0.090%).
| Demographics | Rating | Rank | Married-couple Households |
| Immigrants | Laos | 4.6 /100 | #222 | Tragic 45.1% |
| Immigrants | Cambodia | 2.7 /100 | #223 | Tragic 44.9% |
| Immigrants | Micronesia | 2.6 /100 | #224 | Tragic 44.9% |
| Dutch West Indians | 2.6 /100 | #225 | Tragic 44.9% |
| Alsatians | 2.3 /100 | #226 | Tragic 44.8% |
| Salvadorans | 1.9 /100 | #227 | Tragic 44.7% |
| Kenyans | 1.7 /100 | #228 | Tragic 44.7% |
| Immigrants | Latin America | 1.6 /100 | #229 | Tragic 44.7% |
| Soviet Union | 1.6 /100 | #230 | Tragic 44.6% |
| Houma | 1.5 /100 | #231 | Tragic 44.6% |
| Marshallese | 1.5 /100 | #232 | Tragic 44.6% |
| Immigrants | Uganda | 1.5 /100 | #233 | Tragic 44.6% |
| Immigrants | Panama | 1.3 /100 | #234 | Tragic 44.6% |
| Immigrants | Nicaragua | 1.2 /100 | #235 | Tragic 44.5% |
| Yaqui | 1.2 /100 | #236 | Tragic 44.5% |