Cajun vs Immigrants from Latin America Married-couple Households
COMPARE
Cajun
Immigrants from Latin America
Married-couple Households
Married-couple Households Comparison
Cajuns
Immigrants from Latin America
46.4%
MARRIED-COUPLE HOUSEHOLDS
45.2/ 100
METRIC RATING
176th/ 347
METRIC RANK
44.7%
MARRIED-COUPLE HOUSEHOLDS
1.6/ 100
METRIC RATING
229th/ 347
METRIC RANK
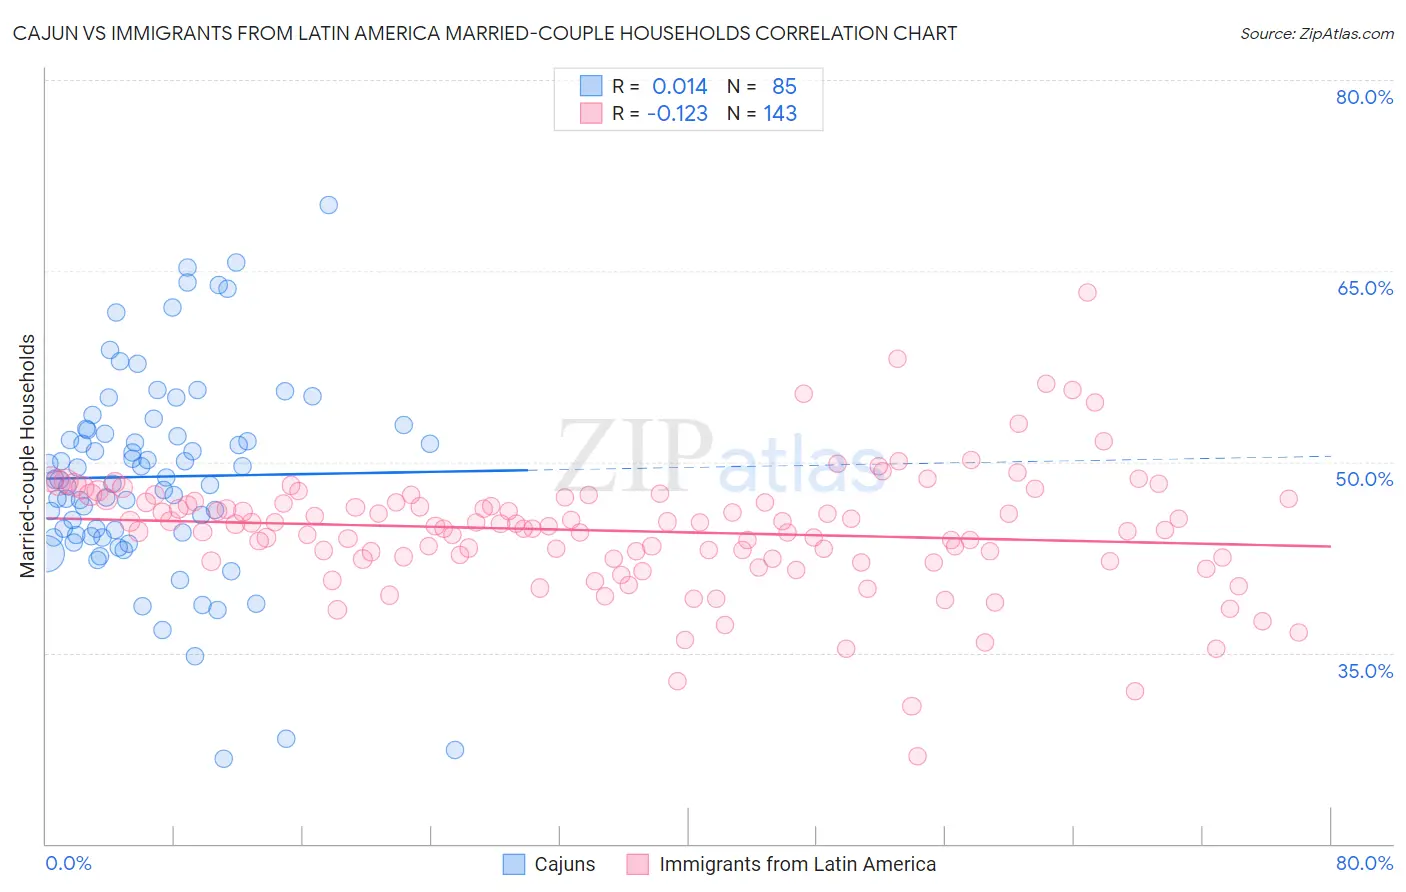
Cajun vs Immigrants from Latin America Married-couple Households Correlation Chart
The statistical analysis conducted on geographies consisting of 149,695,454 people shows no correlation between the proportion of Cajuns and percentage of married-couple family households in the United States with a correlation coefficient (R) of 0.014 and weighted average of 46.4%. Similarly, the statistical analysis conducted on geographies consisting of 557,974,846 people shows a poor negative correlation between the proportion of Immigrants from Latin America and percentage of married-couple family households in the United States with a correlation coefficient (R) of -0.123 and weighted average of 44.7%, a difference of 3.8%.
Married-couple Households Correlation Summary
| Measurement | Cajun | Immigrants from Latin America |
| Minimum | 26.7% | 26.9% |
| Maximum | 70.1% | 63.3% |
| Range | 43.5% | 36.4% |
| Mean | 48.8% | 44.6% |
| Median | 48.6% | 45.0% |
| Interquartile 25% (IQ1) | 44.2% | 42.4% |
| Interquartile 75% (IQ3) | 52.6% | 47.0% |
| Interquartile Range (IQR) | 8.4% | 4.7% |
| Standard Deviation (Sample) | 8.0% | 4.9% |
| Standard Deviation (Population) | 8.0% | 4.9% |
Similar Demographics by Married-couple Households
Demographics Similar to Cajuns by Married-couple Households
In terms of married-couple households, the demographic groups most similar to Cajuns are Immigrants from Colombia (46.4%, a difference of 0.030%), Immigrants (46.3%, a difference of 0.060%), Immigrants from Costa Rica (46.3%, a difference of 0.070%), Immigrants from Zimbabwe (46.3%, a difference of 0.090%), and Mongolian (46.3%, a difference of 0.12%).
| Demographics | Rating | Rank | Married-couple Households |
| Spanish American Indians | 59.4 /100 | #169 | Average 46.6% |
| South Americans | 58.0 /100 | #170 | Average 46.6% |
| Immigrants | Chile | 55.7 /100 | #171 | Average 46.5% |
| Immigrants | Australia | 54.6 /100 | #172 | Average 46.5% |
| Immigrants | Norway | 52.0 /100 | #173 | Average 46.5% |
| Immigrants | Mexico | 50.0 /100 | #174 | Average 46.4% |
| Immigrants | Colombia | 46.1 /100 | #175 | Average 46.4% |
| Cajuns | 45.2 /100 | #176 | Average 46.4% |
| Immigrants | Immigrants | 43.8 /100 | #177 | Average 46.3% |
| Immigrants | Costa Rica | 43.4 /100 | #178 | Average 46.3% |
| Immigrants | Zimbabwe | 43.0 /100 | #179 | Average 46.3% |
| Mongolians | 42.0 /100 | #180 | Average 46.3% |
| Malaysians | 41.8 /100 | #181 | Average 46.3% |
| Yugoslavians | 38.9 /100 | #182 | Fair 46.2% |
| Immigrants | Brazil | 38.3 /100 | #183 | Fair 46.2% |
Demographics Similar to Immigrants from Latin America by Married-couple Households
In terms of married-couple households, the demographic groups most similar to Immigrants from Latin America are Soviet Union (44.6%, a difference of 0.040%), Kenyan (44.7%, a difference of 0.050%), Houma (44.6%, a difference of 0.050%), Marshallese (44.6%, a difference of 0.050%), and Immigrants from Uganda (44.6%, a difference of 0.090%).
| Demographics | Rating | Rank | Married-couple Households |
| Immigrants | Laos | 4.6 /100 | #222 | Tragic 45.1% |
| Immigrants | Cambodia | 2.7 /100 | #223 | Tragic 44.9% |
| Immigrants | Micronesia | 2.6 /100 | #224 | Tragic 44.9% |
| Dutch West Indians | 2.6 /100 | #225 | Tragic 44.9% |
| Alsatians | 2.3 /100 | #226 | Tragic 44.8% |
| Salvadorans | 1.9 /100 | #227 | Tragic 44.7% |
| Kenyans | 1.7 /100 | #228 | Tragic 44.7% |
| Immigrants | Latin America | 1.6 /100 | #229 | Tragic 44.7% |
| Soviet Union | 1.6 /100 | #230 | Tragic 44.6% |
| Houma | 1.5 /100 | #231 | Tragic 44.6% |
| Marshallese | 1.5 /100 | #232 | Tragic 44.6% |
| Immigrants | Uganda | 1.5 /100 | #233 | Tragic 44.6% |
| Immigrants | Panama | 1.3 /100 | #234 | Tragic 44.6% |
| Immigrants | Nicaragua | 1.2 /100 | #235 | Tragic 44.5% |
| Yaqui | 1.2 /100 | #236 | Tragic 44.5% |