Immigrants from Panama vs Subsaharan African Disability Age Under 5
COMPARE
Immigrants from Panama
Subsaharan African
Disability Age Under 5
Disability Age Under 5 Comparison
Immigrants from Panama
Sub-Saharan Africans
1.2%
DISABILITY AGE UNDER 5
95.0/ 100
METRIC RATING
109th/ 347
METRIC RANK
1.3%
DISABILITY AGE UNDER 5
8.3/ 100
METRIC RATING
221st/ 347
METRIC RANK
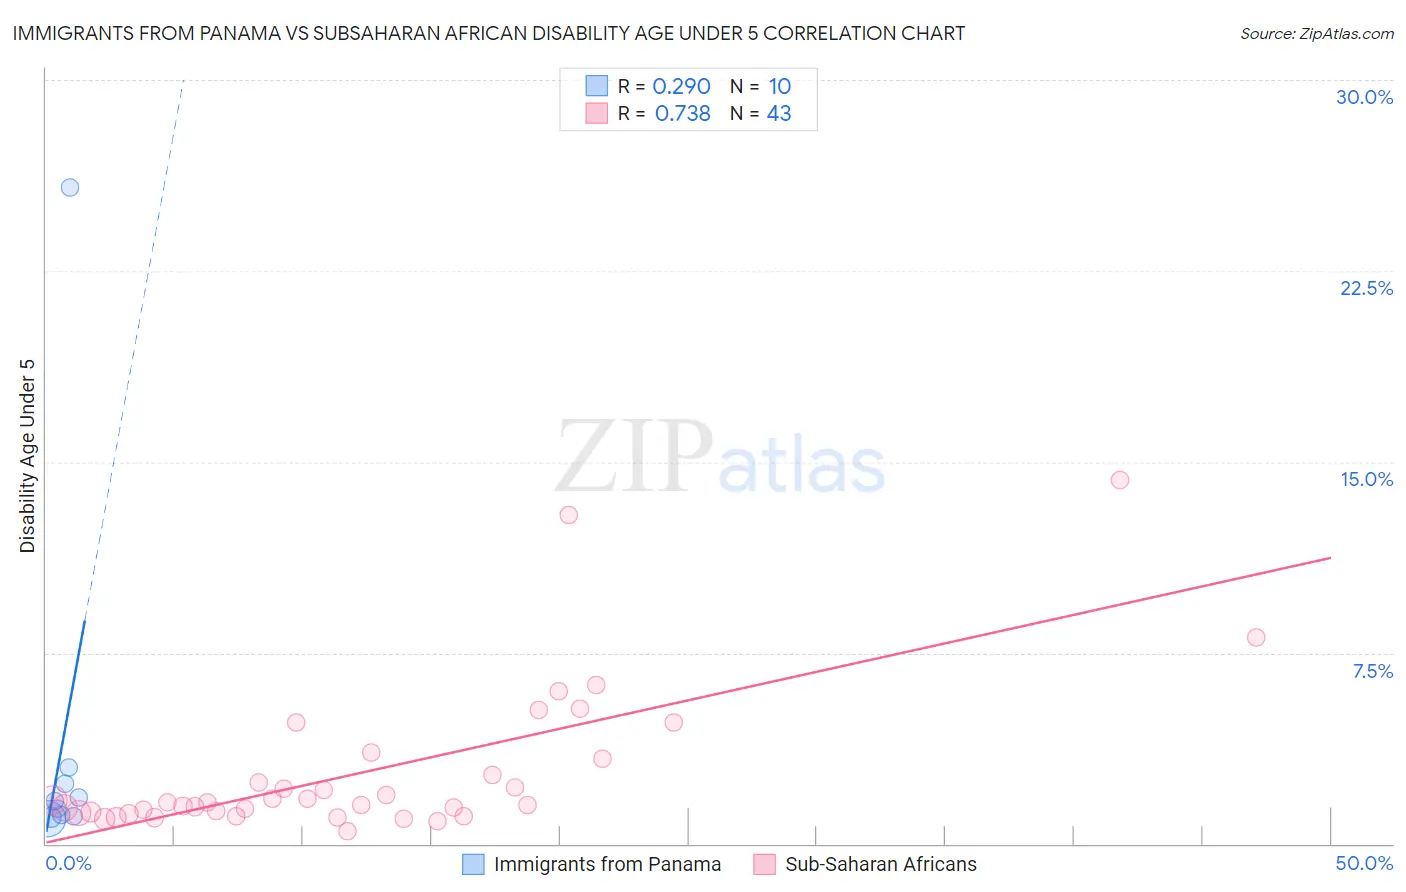
Immigrants from Panama vs Subsaharan African Disability Age Under 5 Correlation Chart
The statistical analysis conducted on geographies consisting of 142,970,984 people shows a weak positive correlation between the proportion of Immigrants from Panama and percentage of population with a disability under the age of 5 in the United States with a correlation coefficient (R) of 0.290 and weighted average of 1.2%. Similarly, the statistical analysis conducted on geographies consisting of 252,320,472 people shows a strong positive correlation between the proportion of Sub-Saharan Africans and percentage of population with a disability under the age of 5 in the United States with a correlation coefficient (R) of 0.738 and weighted average of 1.3%, a difference of 13.0%.
Disability Age Under 5 Correlation Summary
| Measurement | Immigrants from Panama | Subsaharan African |
| Minimum | 1.0% | 0.47% |
| Maximum | 25.8% | 14.3% |
| Range | 24.8% | 13.8% |
| Mean | 4.0% | 2.8% |
| Median | 1.5% | 1.6% |
| Interquartile 25% (IQ1) | 1.1% | 1.2% |
| Interquartile 75% (IQ3) | 2.4% | 3.4% |
| Interquartile Range (IQR) | 1.3% | 2.1% |
| Standard Deviation (Sample) | 7.7% | 3.0% |
| Standard Deviation (Population) | 7.3% | 2.9% |
Similar Demographics by Disability Age Under 5
Demographics Similar to Immigrants from Panama by Disability Age Under 5
In terms of disability age under 5, the demographic groups most similar to Immigrants from Panama are Iraqi (1.2%, a difference of 0.020%), Immigrants from Lebanon (1.2%, a difference of 0.020%), Immigrants from West Indies (1.2%, a difference of 0.15%), Cambodian (1.2%, a difference of 0.19%), and Senegalese (1.2%, a difference of 0.22%).
| Demographics | Rating | Rank | Disability Age Under 5 |
| Immigrants | Morocco | 96.0 /100 | #102 | Exceptional 1.2% |
| Immigrants | Nicaragua | 96.0 /100 | #103 | Exceptional 1.2% |
| Indonesians | 95.9 /100 | #104 | Exceptional 1.2% |
| Immigrants | South Africa | 95.6 /100 | #105 | Exceptional 1.2% |
| Cambodians | 95.4 /100 | #106 | Exceptional 1.2% |
| Immigrants | West Indies | 95.3 /100 | #107 | Exceptional 1.2% |
| Iraqis | 95.1 /100 | #108 | Exceptional 1.2% |
| Immigrants | Panama | 95.0 /100 | #109 | Exceptional 1.2% |
| Immigrants | Lebanon | 95.0 /100 | #110 | Exceptional 1.2% |
| Senegalese | 94.6 /100 | #111 | Exceptional 1.2% |
| Immigrants | Australia | 94.4 /100 | #112 | Exceptional 1.2% |
| Immigrants | Oceania | 94.2 /100 | #113 | Exceptional 1.2% |
| Belizeans | 93.9 /100 | #114 | Exceptional 1.2% |
| Immigrants | Caribbean | 93.8 /100 | #115 | Exceptional 1.2% |
| Immigrants | Northern Africa | 93.8 /100 | #116 | Exceptional 1.2% |
Demographics Similar to Sub-Saharan Africans by Disability Age Under 5
In terms of disability age under 5, the demographic groups most similar to Sub-Saharan Africans are Ukrainian (1.3%, a difference of 0.0%), Hispanic or Latino (1.3%, a difference of 0.19%), Serbian (1.3%, a difference of 0.34%), Latvian (1.3%, a difference of 0.35%), and Panamanian (1.3%, a difference of 0.38%).
| Demographics | Rating | Rank | Disability Age Under 5 |
| Immigrants | Chile | 17.2 /100 | #214 | Poor 1.3% |
| Syrians | 16.1 /100 | #215 | Poor 1.3% |
| Bangladeshis | 15.5 /100 | #216 | Poor 1.3% |
| Cypriots | 14.9 /100 | #217 | Poor 1.3% |
| Malaysians | 13.2 /100 | #218 | Poor 1.3% |
| Immigrants | Croatia | 11.2 /100 | #219 | Poor 1.3% |
| Serbians | 9.6 /100 | #220 | Tragic 1.3% |
| Sub-Saharan Africans | 8.3 /100 | #221 | Tragic 1.3% |
| Ukrainians | 8.3 /100 | #222 | Tragic 1.3% |
| Hispanics or Latinos | 7.7 /100 | #223 | Tragic 1.3% |
| Latvians | 7.1 /100 | #224 | Tragic 1.3% |
| Panamanians | 7.1 /100 | #225 | Tragic 1.3% |
| Bahamians | 7.1 /100 | #226 | Tragic 1.3% |
| Taiwanese | 6.1 /100 | #227 | Tragic 1.3% |
| Luxembourgers | 6.1 /100 | #228 | Tragic 1.3% |