Immigrants from Panama vs Immigrants from Romania Married-couple Households
COMPARE
Immigrants from Panama
Immigrants from Romania
Married-couple Households
Married-couple Households Comparison
Immigrants from Panama
Immigrants from Romania
44.6%
MARRIED-COUPLE HOUSEHOLDS
1.3/ 100
METRIC RATING
234th/ 347
METRIC RANK
48.3%
MARRIED-COUPLE HOUSEHOLDS
98.6/ 100
METRIC RATING
74th/ 347
METRIC RANK
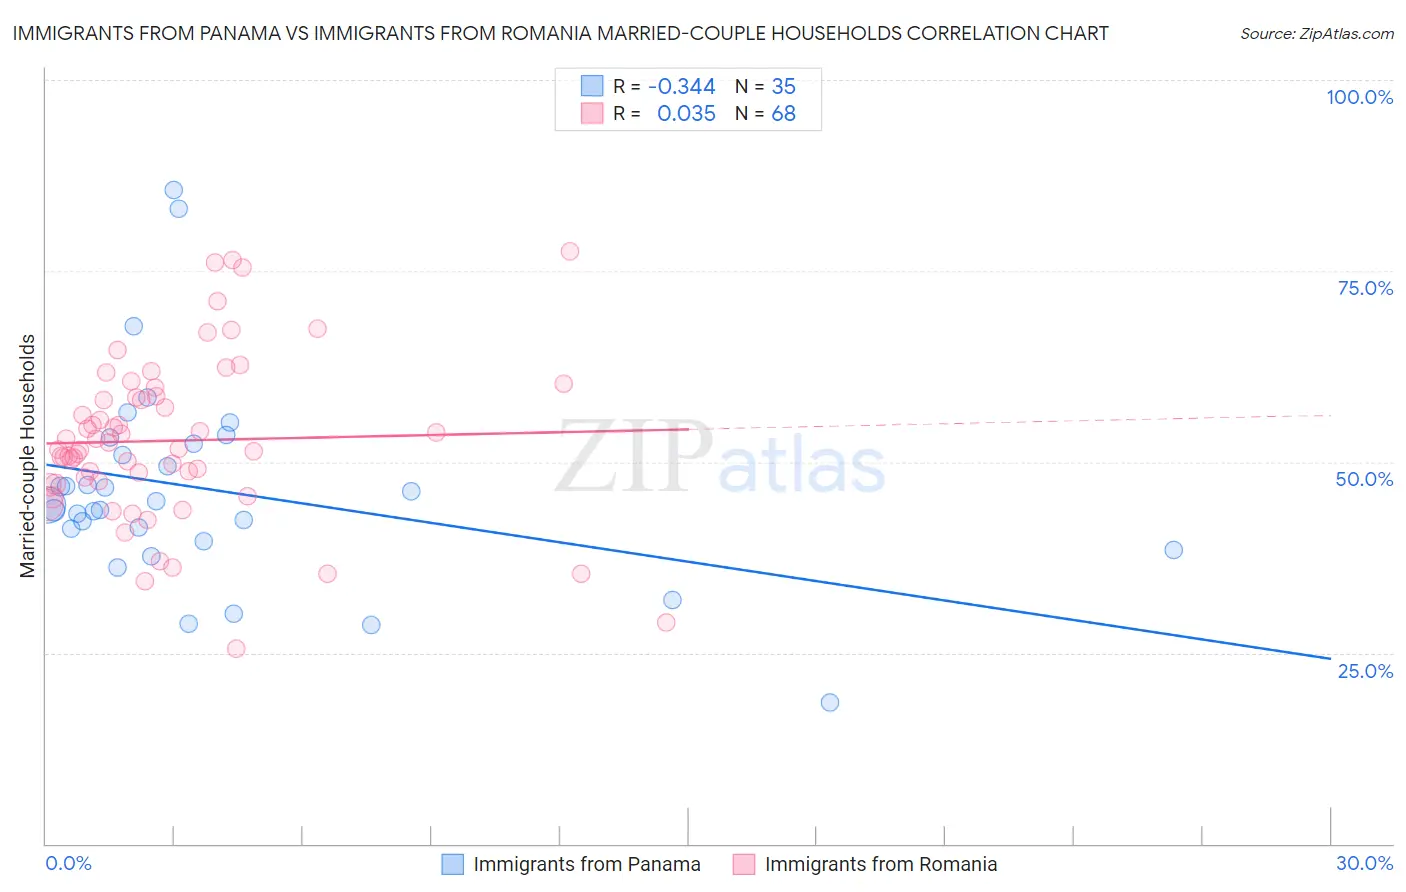
Immigrants from Panama vs Immigrants from Romania Married-couple Households Correlation Chart
The statistical analysis conducted on geographies consisting of 221,156,465 people shows a mild negative correlation between the proportion of Immigrants from Panama and percentage of married-couple family households in the United States with a correlation coefficient (R) of -0.344 and weighted average of 44.6%. Similarly, the statistical analysis conducted on geographies consisting of 256,957,866 people shows no correlation between the proportion of Immigrants from Romania and percentage of married-couple family households in the United States with a correlation coefficient (R) of 0.035 and weighted average of 48.3%, a difference of 8.4%.
Married-couple Households Correlation Summary
| Measurement | Immigrants from Panama | Immigrants from Romania |
| Minimum | 18.6% | 25.5% |
| Maximum | 85.7% | 77.6% |
| Range | 67.1% | 52.1% |
| Mean | 46.3% | 52.8% |
| Median | 44.4% | 51.7% |
| Interquartile 25% (IQ1) | 39.6% | 47.3% |
| Interquartile 75% (IQ3) | 52.4% | 58.5% |
| Interquartile Range (IQR) | 12.9% | 11.2% |
| Standard Deviation (Sample) | 13.4% | 10.7% |
| Standard Deviation (Population) | 13.2% | 10.7% |
Similar Demographics by Married-couple Households
Demographics Similar to Immigrants from Panama by Married-couple Households
In terms of married-couple households, the demographic groups most similar to Immigrants from Panama are Immigrants from Nicaragua (44.5%, a difference of 0.070%), Yaqui (44.5%, a difference of 0.080%), Comanche (44.5%, a difference of 0.11%), Immigrants from Uganda (44.6%, a difference of 0.12%), and Houma (44.6%, a difference of 0.16%).
| Demographics | Rating | Rank | Married-couple Households |
| Salvadorans | 1.9 /100 | #227 | Tragic 44.7% |
| Kenyans | 1.7 /100 | #228 | Tragic 44.7% |
| Immigrants | Latin America | 1.6 /100 | #229 | Tragic 44.7% |
| Soviet Union | 1.6 /100 | #230 | Tragic 44.6% |
| Houma | 1.5 /100 | #231 | Tragic 44.6% |
| Marshallese | 1.5 /100 | #232 | Tragic 44.6% |
| Immigrants | Uganda | 1.5 /100 | #233 | Tragic 44.6% |
| Immigrants | Panama | 1.3 /100 | #234 | Tragic 44.6% |
| Immigrants | Nicaragua | 1.2 /100 | #235 | Tragic 44.5% |
| Yaqui | 1.2 /100 | #236 | Tragic 44.5% |
| Comanche | 1.2 /100 | #237 | Tragic 44.5% |
| Immigrants | Uruguay | 1.1 /100 | #238 | Tragic 44.5% |
| Spanish Americans | 1.1 /100 | #239 | Tragic 44.5% |
| Ute | 1.0 /100 | #240 | Tragic 44.4% |
| Immigrants | Bosnia and Herzegovina | 1.0 /100 | #241 | Tragic 44.4% |
Demographics Similar to Immigrants from Romania by Married-couple Households
In terms of married-couple households, the demographic groups most similar to Immigrants from Romania are Immigrants from Singapore (48.3%, a difference of 0.010%), Scotch-Irish (48.3%, a difference of 0.040%), Immigrants from England (48.2%, a difference of 0.090%), Immigrants from Fiji (48.2%, a difference of 0.090%), and Canadian (48.2%, a difference of 0.19%).
| Demographics | Rating | Rank | Married-couple Households |
| Romanians | 98.9 /100 | #67 | Exceptional 48.4% |
| Immigrants | South Eastern Asia | 98.9 /100 | #68 | Exceptional 48.4% |
| Immigrants | China | 98.9 /100 | #69 | Exceptional 48.4% |
| Immigrants | North America | 98.9 /100 | #70 | Exceptional 48.4% |
| Laotians | 98.8 /100 | #71 | Exceptional 48.4% |
| Scotch-Irish | 98.6 /100 | #72 | Exceptional 48.3% |
| Immigrants | Singapore | 98.6 /100 | #73 | Exceptional 48.3% |
| Immigrants | Romania | 98.6 /100 | #74 | Exceptional 48.3% |
| Immigrants | England | 98.4 /100 | #75 | Exceptional 48.2% |
| Immigrants | Fiji | 98.4 /100 | #76 | Exceptional 48.2% |
| Canadians | 98.2 /100 | #77 | Exceptional 48.2% |
| Egyptians | 98.2 /100 | #78 | Exceptional 48.2% |
| Immigrants | Netherlands | 98.2 /100 | #79 | Exceptional 48.2% |
| Russians | 98.1 /100 | #80 | Exceptional 48.2% |
| Finns | 98.0 /100 | #81 | Exceptional 48.1% |