Immigrants from Guyana vs Cuban Married-couple Households
COMPARE
Immigrants from Guyana
Cuban
Married-couple Households
Married-couple Households Comparison
Immigrants from Guyana
Cubans
41.6%
MARRIED-COUPLE HOUSEHOLDS
0.0/ 100
METRIC RATING
304th/ 347
METRIC RANK
45.4%
MARRIED-COUPLE HOUSEHOLDS
7.7/ 100
METRIC RATING
210th/ 347
METRIC RANK
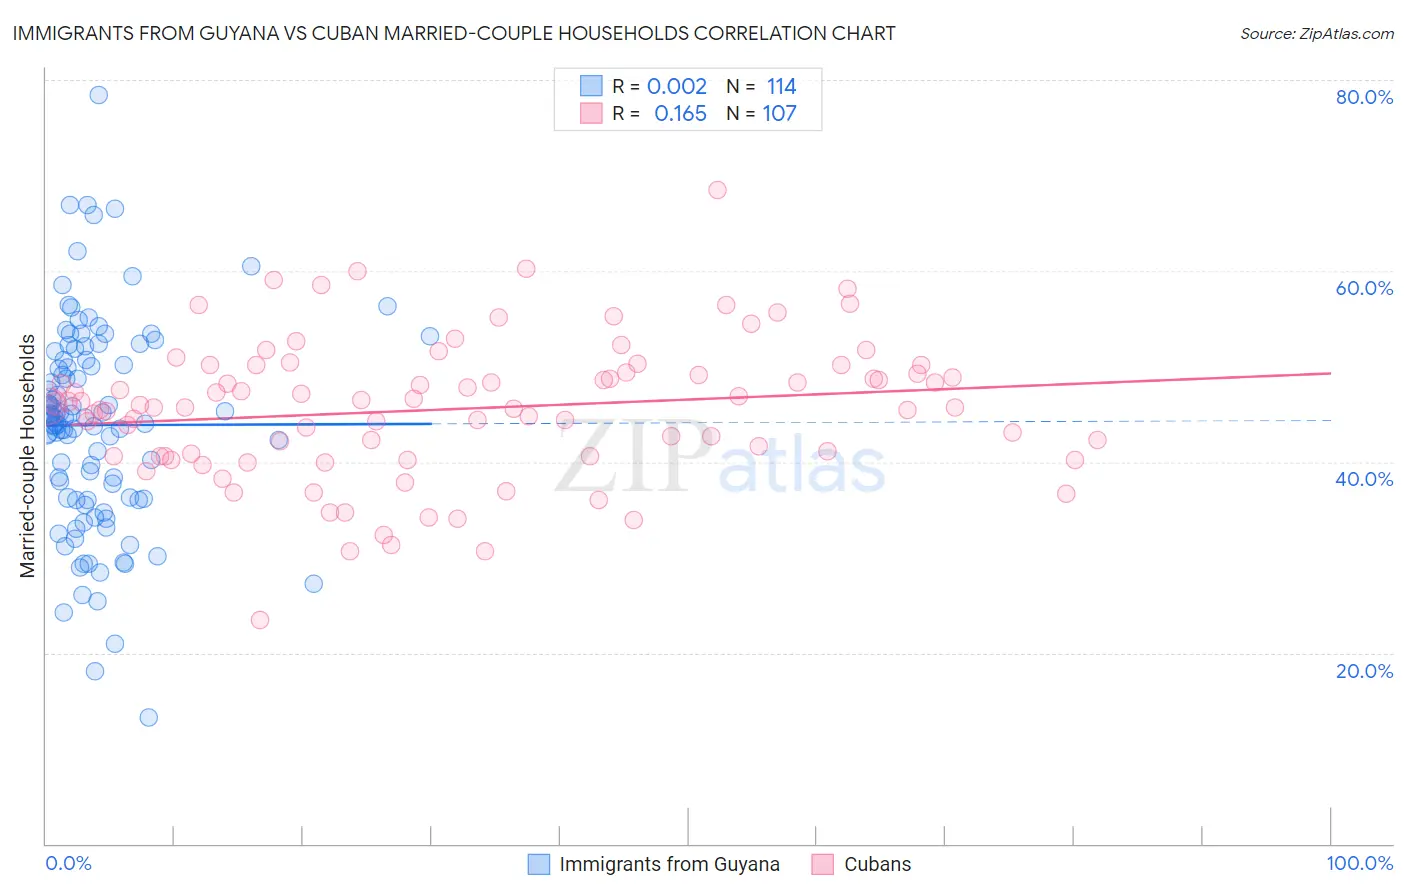
Immigrants from Guyana vs Cuban Married-couple Households Correlation Chart
The statistical analysis conducted on geographies consisting of 183,688,079 people shows no correlation between the proportion of Immigrants from Guyana and percentage of married-couple family households in the United States with a correlation coefficient (R) of 0.002 and weighted average of 41.6%. Similarly, the statistical analysis conducted on geographies consisting of 448,946,522 people shows a poor positive correlation between the proportion of Cubans and percentage of married-couple family households in the United States with a correlation coefficient (R) of 0.165 and weighted average of 45.4%, a difference of 9.1%.
Married-couple Households Correlation Summary
| Measurement | Immigrants from Guyana | Cuban |
| Minimum | 13.3% | 23.5% |
| Maximum | 78.4% | 68.4% |
| Range | 65.2% | 45.0% |
| Mean | 43.9% | 45.5% |
| Median | 44.6% | 45.8% |
| Interquartile 25% (IQ1) | 36.2% | 40.6% |
| Interquartile 75% (IQ3) | 50.7% | 49.4% |
| Interquartile Range (IQR) | 14.5% | 8.8% |
| Standard Deviation (Sample) | 10.9% | 7.3% |
| Standard Deviation (Population) | 10.8% | 7.3% |
Similar Demographics by Married-couple Households
Demographics Similar to Immigrants from Guyana by Married-couple Households
In terms of married-couple households, the demographic groups most similar to Immigrants from Guyana are Subsaharan African (41.6%, a difference of 0.11%), Sioux (41.5%, a difference of 0.11%), Immigrants from Honduras (41.6%, a difference of 0.12%), Immigrants from Bahamas (41.7%, a difference of 0.29%), and Guyanese (41.4%, a difference of 0.48%).
| Demographics | Rating | Rank | Married-couple Households |
| Arapaho | 0.0 /100 | #297 | Tragic 41.8% |
| Immigrants | Middle Africa | 0.0 /100 | #298 | Tragic 41.8% |
| Immigrants | Ghana | 0.0 /100 | #299 | Tragic 41.8% |
| Immigrants | Belize | 0.0 /100 | #300 | Tragic 41.8% |
| Immigrants | Bahamas | 0.0 /100 | #301 | Tragic 41.7% |
| Immigrants | Honduras | 0.0 /100 | #302 | Tragic 41.6% |
| Sub-Saharan Africans | 0.0 /100 | #303 | Tragic 41.6% |
| Immigrants | Guyana | 0.0 /100 | #304 | Tragic 41.6% |
| Sioux | 0.0 /100 | #305 | Tragic 41.5% |
| Guyanese | 0.0 /100 | #306 | Tragic 41.4% |
| Immigrants | Western Africa | 0.0 /100 | #307 | Tragic 41.4% |
| Crow | 0.0 /100 | #308 | Tragic 41.4% |
| Immigrants | Trinidad and Tobago | 0.0 /100 | #309 | Tragic 41.2% |
| Haitians | 0.0 /100 | #310 | Tragic 41.2% |
| Colville | 0.0 /100 | #311 | Tragic 41.0% |
Demographics Similar to Cubans by Married-couple Households
In terms of married-couple households, the demographic groups most similar to Cubans are Immigrants from Spain (45.3%, a difference of 0.050%), Immigrants from Uzbekistan (45.4%, a difference of 0.090%), Hispanic or Latino (45.4%, a difference of 0.13%), Immigrants from France (45.4%, a difference of 0.14%), and Creek (45.3%, a difference of 0.18%).
| Demographics | Rating | Rank | Married-couple Households |
| Alaska Natives | 13.0 /100 | #203 | Poor 45.6% |
| Aleuts | 12.5 /100 | #204 | Poor 45.6% |
| Nepalese | 11.9 /100 | #205 | Poor 45.6% |
| Uruguayans | 10.4 /100 | #206 | Poor 45.5% |
| Immigrants | France | 8.8 /100 | #207 | Tragic 45.4% |
| Hispanics or Latinos | 8.7 /100 | #208 | Tragic 45.4% |
| Immigrants | Uzbekistan | 8.4 /100 | #209 | Tragic 45.4% |
| Cubans | 7.7 /100 | #210 | Tragic 45.4% |
| Immigrants | Spain | 7.3 /100 | #211 | Tragic 45.3% |
| Creek | 6.4 /100 | #212 | Tragic 45.3% |
| Yakama | 5.8 /100 | #213 | Tragic 45.2% |
| Japanese | 5.7 /100 | #214 | Tragic 45.2% |
| Immigrants | Nepal | 5.6 /100 | #215 | Tragic 45.2% |
| Immigrants | Portugal | 5.6 /100 | #216 | Tragic 45.2% |
| Panamanians | 5.5 /100 | #217 | Tragic 45.2% |