Immigrants from Guyana vs Cuban In Labor Force | Age 20-24
COMPARE
Immigrants from Guyana
Cuban
In Labor Force | Age 20-24
In Labor Force | Age 20-24 Comparison
Immigrants from Guyana
Cubans
69.3%
IN LABOR FORCE | AGE 20-24
0.0/ 100
METRIC RATING
336th/ 347
METRIC RANK
72.5%
IN LABOR FORCE | AGE 20-24
0.0/ 100
METRIC RATING
301st/ 347
METRIC RANK
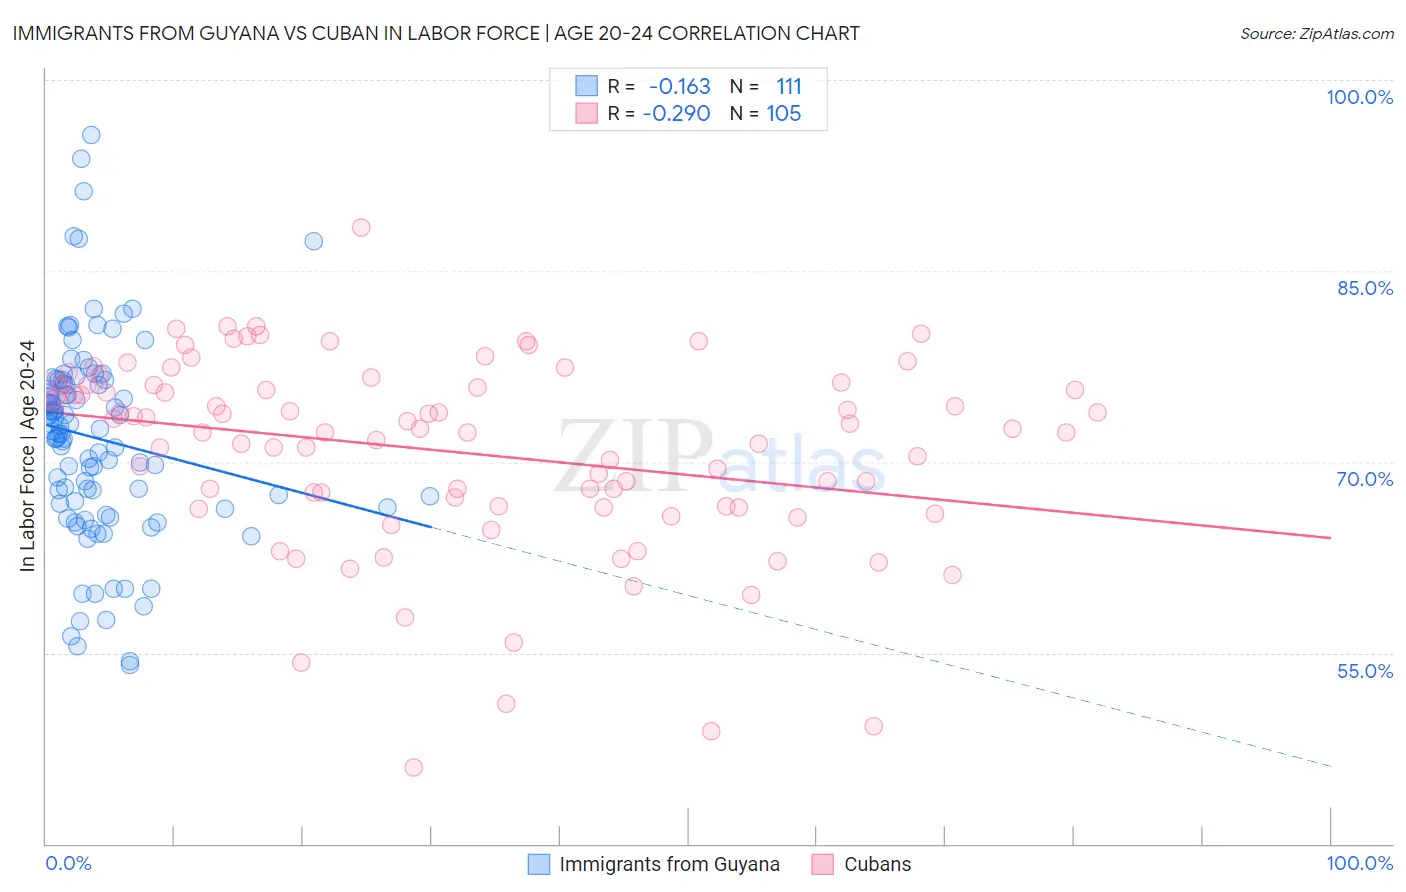
Immigrants from Guyana vs Cuban In Labor Force | Age 20-24 Correlation Chart
The statistical analysis conducted on geographies consisting of 183,673,917 people shows a poor negative correlation between the proportion of Immigrants from Guyana and labor force participation rate among population between the ages 20 and 24 in the United States with a correlation coefficient (R) of -0.163 and weighted average of 69.3%. Similarly, the statistical analysis conducted on geographies consisting of 449,113,848 people shows a weak negative correlation between the proportion of Cubans and labor force participation rate among population between the ages 20 and 24 in the United States with a correlation coefficient (R) of -0.290 and weighted average of 72.5%, a difference of 4.6%.
In Labor Force | Age 20-24 Correlation Summary
| Measurement | Immigrants from Guyana | Cuban |
| Minimum | 54.0% | 46.0% |
| Maximum | 95.7% | 88.4% |
| Range | 41.7% | 42.4% |
| Mean | 71.9% | 70.8% |
| Median | 72.4% | 72.4% |
| Interquartile 25% (IQ1) | 66.7% | 66.4% |
| Interquartile 75% (IQ3) | 76.4% | 76.0% |
| Interquartile Range (IQR) | 9.7% | 9.6% |
| Standard Deviation (Sample) | 7.9% | 7.6% |
| Standard Deviation (Population) | 7.8% | 7.6% |
Similar Demographics by In Labor Force | Age 20-24
Demographics Similar to Immigrants from Guyana by In Labor Force | Age 20-24
In terms of in labor force | age 20-24, the demographic groups most similar to Immigrants from Guyana are Guyanese (69.2%, a difference of 0.13%), Pima (69.0%, a difference of 0.39%), Immigrants from Yemen (68.9%, a difference of 0.52%), Immigrants from Barbados (69.7%, a difference of 0.66%), and Menominee (68.7%, a difference of 0.83%).
| Demographics | Rating | Rank | In Labor Force | Age 20-24 |
| Yup'ik | 0.0 /100 | #329 | Tragic 70.9% |
| Vietnamese | 0.0 /100 | #330 | Tragic 70.6% |
| Immigrants | Bangladesh | 0.0 /100 | #331 | Tragic 70.6% |
| Immigrants | Uzbekistan | 0.0 /100 | #332 | Tragic 70.4% |
| Yuman | 0.0 /100 | #333 | Tragic 70.3% |
| British West Indians | 0.0 /100 | #334 | Tragic 70.0% |
| Immigrants | Barbados | 0.0 /100 | #335 | Tragic 69.7% |
| Immigrants | Guyana | 0.0 /100 | #336 | Tragic 69.3% |
| Guyanese | 0.0 /100 | #337 | Tragic 69.2% |
| Pima | 0.0 /100 | #338 | Tragic 69.0% |
| Immigrants | Yemen | 0.0 /100 | #339 | Tragic 68.9% |
| Menominee | 0.0 /100 | #340 | Tragic 68.7% |
| Tohono O'odham | 0.0 /100 | #341 | Tragic 68.6% |
| Immigrants | St. Vincent and the Grenadines | 0.0 /100 | #342 | Tragic 68.4% |
| Puerto Ricans | 0.0 /100 | #343 | Tragic 68.3% |
Demographics Similar to Cubans by In Labor Force | Age 20-24
In terms of in labor force | age 20-24, the demographic groups most similar to Cubans are Armenian (72.5%, a difference of 0.070%), Iranian (72.6%, a difference of 0.090%), Native/Alaskan (72.4%, a difference of 0.090%), Ecuadorian (72.4%, a difference of 0.10%), and Immigrants from West Indies (72.4%, a difference of 0.11%).
| Demographics | Rating | Rank | In Labor Force | Age 20-24 |
| Immigrants | Argentina | 0.0 /100 | #294 | Tragic 72.8% |
| Okinawans | 0.0 /100 | #295 | Tragic 72.7% |
| Jamaicans | 0.0 /100 | #296 | Tragic 72.7% |
| Central American Indians | 0.0 /100 | #297 | Tragic 72.7% |
| Israelis | 0.0 /100 | #298 | Tragic 72.6% |
| Iranians | 0.0 /100 | #299 | Tragic 72.6% |
| Armenians | 0.0 /100 | #300 | Tragic 72.5% |
| Cubans | 0.0 /100 | #301 | Tragic 72.5% |
| Natives/Alaskans | 0.0 /100 | #302 | Tragic 72.4% |
| Ecuadorians | 0.0 /100 | #303 | Tragic 72.4% |
| Immigrants | West Indies | 0.0 /100 | #304 | Tragic 72.4% |
| Immigrants | Singapore | 0.0 /100 | #305 | Tragic 72.4% |
| Immigrants | Jamaica | 0.0 /100 | #306 | Tragic 72.4% |
| Immigrants | Ecuador | 0.0 /100 | #307 | Tragic 72.3% |
| Soviet Union | 0.0 /100 | #308 | Tragic 72.3% |