Immigrants from Guyana vs Cuban 11th Grade
COMPARE
Immigrants from Guyana
Cuban
11th Grade
11th Grade Comparison
Immigrants from Guyana
Cubans
89.7%
11TH GRADE
0.0/ 100
METRIC RATING
302nd/ 347
METRIC RANK
90.2%
11TH GRADE
0.0/ 100
METRIC RATING
292nd/ 347
METRIC RANK
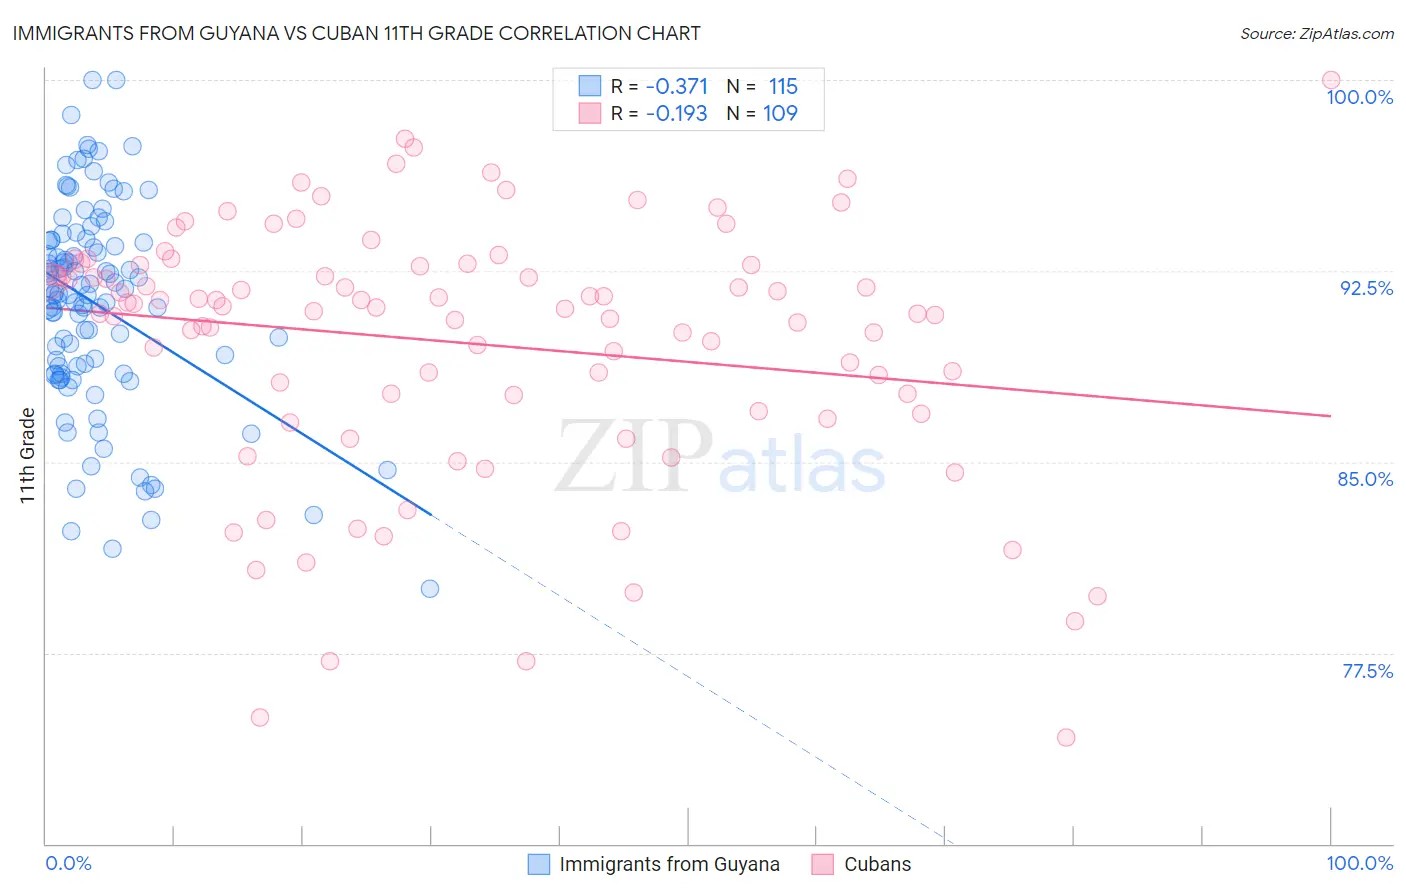
Immigrants from Guyana vs Cuban 11th Grade Correlation Chart
The statistical analysis conducted on geographies consisting of 183,673,461 people shows a mild negative correlation between the proportion of Immigrants from Guyana and percentage of population with at least 11th grade education in the United States with a correlation coefficient (R) of -0.371 and weighted average of 89.7%. Similarly, the statistical analysis conducted on geographies consisting of 449,369,652 people shows a poor negative correlation between the proportion of Cubans and percentage of population with at least 11th grade education in the United States with a correlation coefficient (R) of -0.193 and weighted average of 90.2%, a difference of 0.59%.
11th Grade Correlation Summary
| Measurement | Immigrants from Guyana | Cuban |
| Minimum | 80.0% | 74.2% |
| Maximum | 100.0% | 100.0% |
| Range | 20.0% | 25.8% |
| Mean | 91.2% | 89.7% |
| Median | 91.6% | 91.1% |
| Interquartile 25% (IQ1) | 88.5% | 87.3% |
| Interquartile 75% (IQ3) | 93.7% | 92.7% |
| Interquartile Range (IQR) | 5.2% | 5.4% |
| Standard Deviation (Sample) | 4.1% | 5.1% |
| Standard Deviation (Population) | 4.0% | 5.0% |
Demographics Similar to Immigrants from Guyana and Cubans by 11th Grade
In terms of 11th grade, the demographic groups most similar to Immigrants from Guyana are Immigrants (89.7%, a difference of 0.010%), Yuman (89.7%, a difference of 0.010%), Immigrants from Cambodia (89.6%, a difference of 0.090%), Ecuadorian (89.6%, a difference of 0.14%), and Guyanese (89.9%, a difference of 0.19%). Similarly, the demographic groups most similar to Cubans are Haitian (90.3%, a difference of 0.030%), Indonesian (90.3%, a difference of 0.070%), Native/Alaskan (90.2%, a difference of 0.070%), British West Indian (90.3%, a difference of 0.090%), and Pennsylvania German (90.3%, a difference of 0.11%).
| Demographics | Rating | Rank | 11th Grade |
| Apache | 0.0 /100 | #287 | Tragic 90.4% |
| Pennsylvania Germans | 0.0 /100 | #288 | Tragic 90.3% |
| British West Indians | 0.0 /100 | #289 | Tragic 90.3% |
| Indonesians | 0.0 /100 | #290 | Tragic 90.3% |
| Haitians | 0.0 /100 | #291 | Tragic 90.3% |
| Cubans | 0.0 /100 | #292 | Tragic 90.2% |
| Natives/Alaskans | 0.0 /100 | #293 | Tragic 90.2% |
| Immigrants | Grenada | 0.0 /100 | #294 | Tragic 90.1% |
| Immigrants | Vietnam | 0.0 /100 | #295 | Tragic 90.0% |
| Fijians | 0.0 /100 | #296 | Tragic 90.0% |
| Navajo | 0.0 /100 | #297 | Tragic 90.0% |
| Immigrants | Fiji | 0.0 /100 | #298 | Tragic 89.9% |
| Japanese | 0.0 /100 | #299 | Tragic 89.9% |
| Immigrants | Haiti | 0.0 /100 | #300 | Tragic 89.9% |
| Guyanese | 0.0 /100 | #301 | Tragic 89.9% |
| Immigrants | Guyana | 0.0 /100 | #302 | Tragic 89.7% |
| Immigrants | Immigrants | 0.0 /100 | #303 | Tragic 89.7% |
| Yuman | 0.0 /100 | #304 | Tragic 89.7% |
| Immigrants | Cambodia | 0.0 /100 | #305 | Tragic 89.6% |
| Ecuadorians | 0.0 /100 | #306 | Tragic 89.6% |
| Immigrants | Dominica | 0.0 /100 | #307 | Tragic 89.5% |