Immigrants from Guyana vs Immigrants from Italy Married-couple Households
COMPARE
Immigrants from Guyana
Immigrants from Italy
Married-couple Households
Married-couple Households Comparison
Immigrants from Guyana
Immigrants from Italy
41.6%
MARRIED-COUPLE HOUSEHOLDS
0.0/ 100
METRIC RATING
304th/ 347
METRIC RANK
47.9%
MARRIED-COUPLE HOUSEHOLDS
96.3/ 100
METRIC RATING
100th/ 347
METRIC RANK
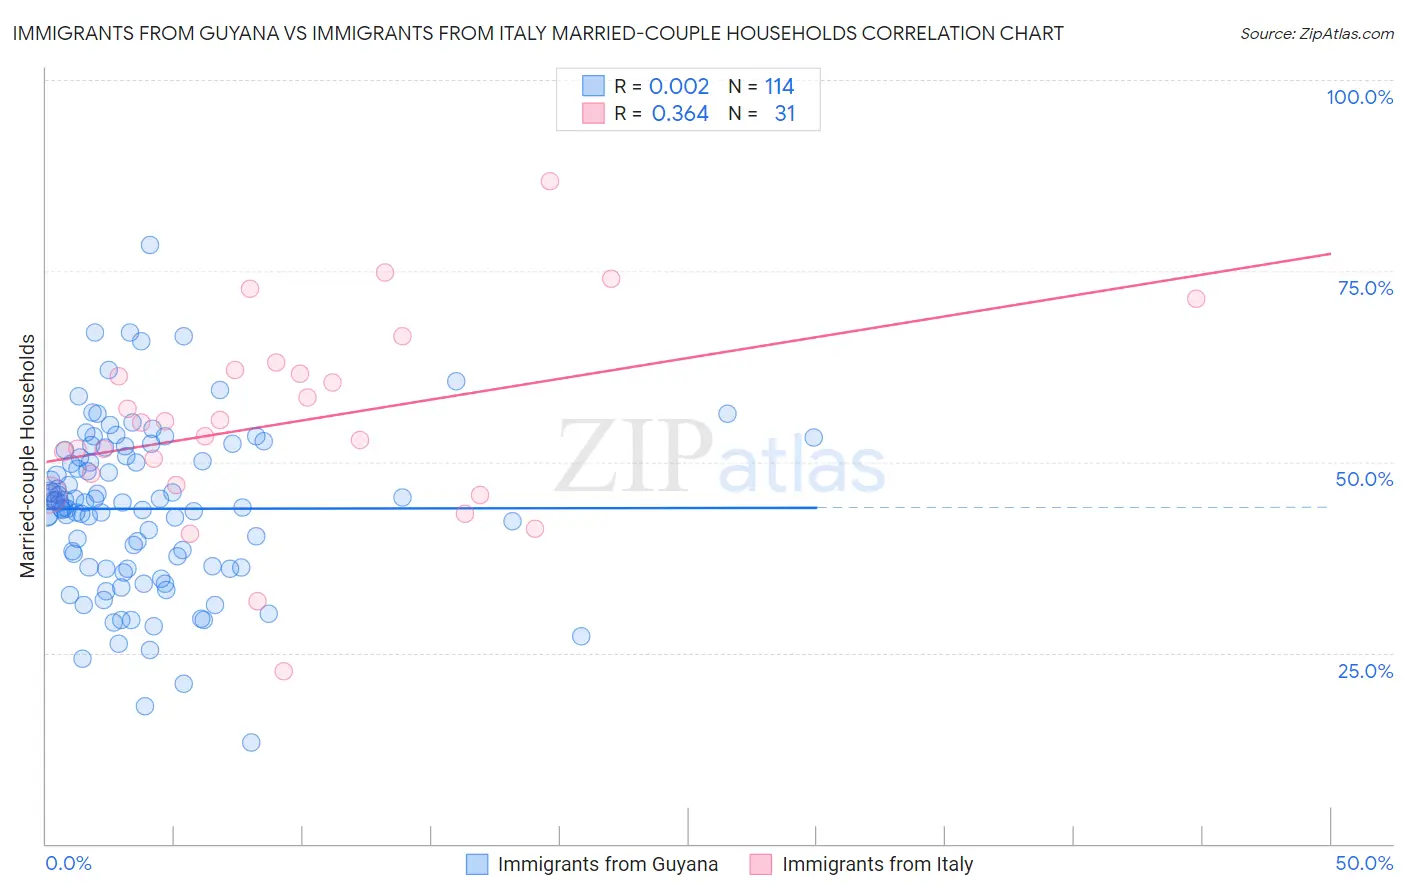
Immigrants from Guyana vs Immigrants from Italy Married-couple Households Correlation Chart
The statistical analysis conducted on geographies consisting of 183,688,079 people shows no correlation between the proportion of Immigrants from Guyana and percentage of married-couple family households in the United States with a correlation coefficient (R) of 0.002 and weighted average of 41.6%. Similarly, the statistical analysis conducted on geographies consisting of 324,146,965 people shows a mild positive correlation between the proportion of Immigrants from Italy and percentage of married-couple family households in the United States with a correlation coefficient (R) of 0.364 and weighted average of 47.9%, a difference of 15.2%.
Married-couple Households Correlation Summary
| Measurement | Immigrants from Guyana | Immigrants from Italy |
| Minimum | 13.3% | 22.5% |
| Maximum | 78.4% | 86.8% |
| Range | 65.2% | 64.2% |
| Mean | 43.9% | 55.3% |
| Median | 44.6% | 55.1% |
| Interquartile 25% (IQ1) | 36.2% | 47.0% |
| Interquartile 75% (IQ3) | 50.7% | 62.1% |
| Interquartile Range (IQR) | 14.5% | 15.1% |
| Standard Deviation (Sample) | 10.9% | 13.2% |
| Standard Deviation (Population) | 10.8% | 12.9% |
Similar Demographics by Married-couple Households
Demographics Similar to Immigrants from Guyana by Married-couple Households
In terms of married-couple households, the demographic groups most similar to Immigrants from Guyana are Subsaharan African (41.6%, a difference of 0.11%), Sioux (41.5%, a difference of 0.11%), Immigrants from Honduras (41.6%, a difference of 0.12%), Immigrants from Bahamas (41.7%, a difference of 0.29%), and Guyanese (41.4%, a difference of 0.48%).
| Demographics | Rating | Rank | Married-couple Households |
| Arapaho | 0.0 /100 | #297 | Tragic 41.8% |
| Immigrants | Middle Africa | 0.0 /100 | #298 | Tragic 41.8% |
| Immigrants | Ghana | 0.0 /100 | #299 | Tragic 41.8% |
| Immigrants | Belize | 0.0 /100 | #300 | Tragic 41.8% |
| Immigrants | Bahamas | 0.0 /100 | #301 | Tragic 41.7% |
| Immigrants | Honduras | 0.0 /100 | #302 | Tragic 41.6% |
| Sub-Saharan Africans | 0.0 /100 | #303 | Tragic 41.6% |
| Immigrants | Guyana | 0.0 /100 | #304 | Tragic 41.6% |
| Sioux | 0.0 /100 | #305 | Tragic 41.5% |
| Guyanese | 0.0 /100 | #306 | Tragic 41.4% |
| Immigrants | Western Africa | 0.0 /100 | #307 | Tragic 41.4% |
| Crow | 0.0 /100 | #308 | Tragic 41.4% |
| Immigrants | Trinidad and Tobago | 0.0 /100 | #309 | Tragic 41.2% |
| Haitians | 0.0 /100 | #310 | Tragic 41.2% |
| Colville | 0.0 /100 | #311 | Tragic 41.0% |
Demographics Similar to Immigrants from Italy by Married-couple Households
In terms of married-couple households, the demographic groups most similar to Immigrants from Italy are Immigrants from Austria (47.9%, a difference of 0.010%), Immigrants from North Macedonia (47.9%, a difference of 0.020%), Latvian (47.9%, a difference of 0.030%), Immigrants from Egypt (47.9%, a difference of 0.060%), and Turkish (47.8%, a difference of 0.060%).
| Demographics | Rating | Rank | Married-couple Households |
| Lebanese | 96.9 /100 | #93 | Exceptional 47.9% |
| Americans | 96.9 /100 | #94 | Exceptional 47.9% |
| Immigrants | Belgium | 96.8 /100 | #95 | Exceptional 47.9% |
| Immigrants | Egypt | 96.6 /100 | #96 | Exceptional 47.9% |
| Latvians | 96.5 /100 | #97 | Exceptional 47.9% |
| Immigrants | North Macedonia | 96.4 /100 | #98 | Exceptional 47.9% |
| Immigrants | Austria | 96.4 /100 | #99 | Exceptional 47.9% |
| Immigrants | Italy | 96.3 /100 | #100 | Exceptional 47.9% |
| Turks | 96.1 /100 | #101 | Exceptional 47.8% |
| Slavs | 96.0 /100 | #102 | Exceptional 47.8% |
| Hawaiians | 96.0 /100 | #103 | Exceptional 47.8% |
| Immigrants | South Africa | 96.0 /100 | #104 | Exceptional 47.8% |
| Immigrants | Czechoslovakia | 95.5 /100 | #105 | Exceptional 47.8% |
| Portuguese | 95.5 /100 | #106 | Exceptional 47.8% |
| Estonians | 94.7 /100 | #107 | Exceptional 47.7% |