Pima vs Cuban Married-couple Households
COMPARE
Pima
Cuban
Married-couple Households
Married-couple Households Comparison
Pima
Cubans
35.6%
MARRIED-COUPLE HOUSEHOLDS
0.0/ 100
METRIC RATING
347th/ 347
METRIC RANK
45.4%
MARRIED-COUPLE HOUSEHOLDS
7.7/ 100
METRIC RATING
210th/ 347
METRIC RANK
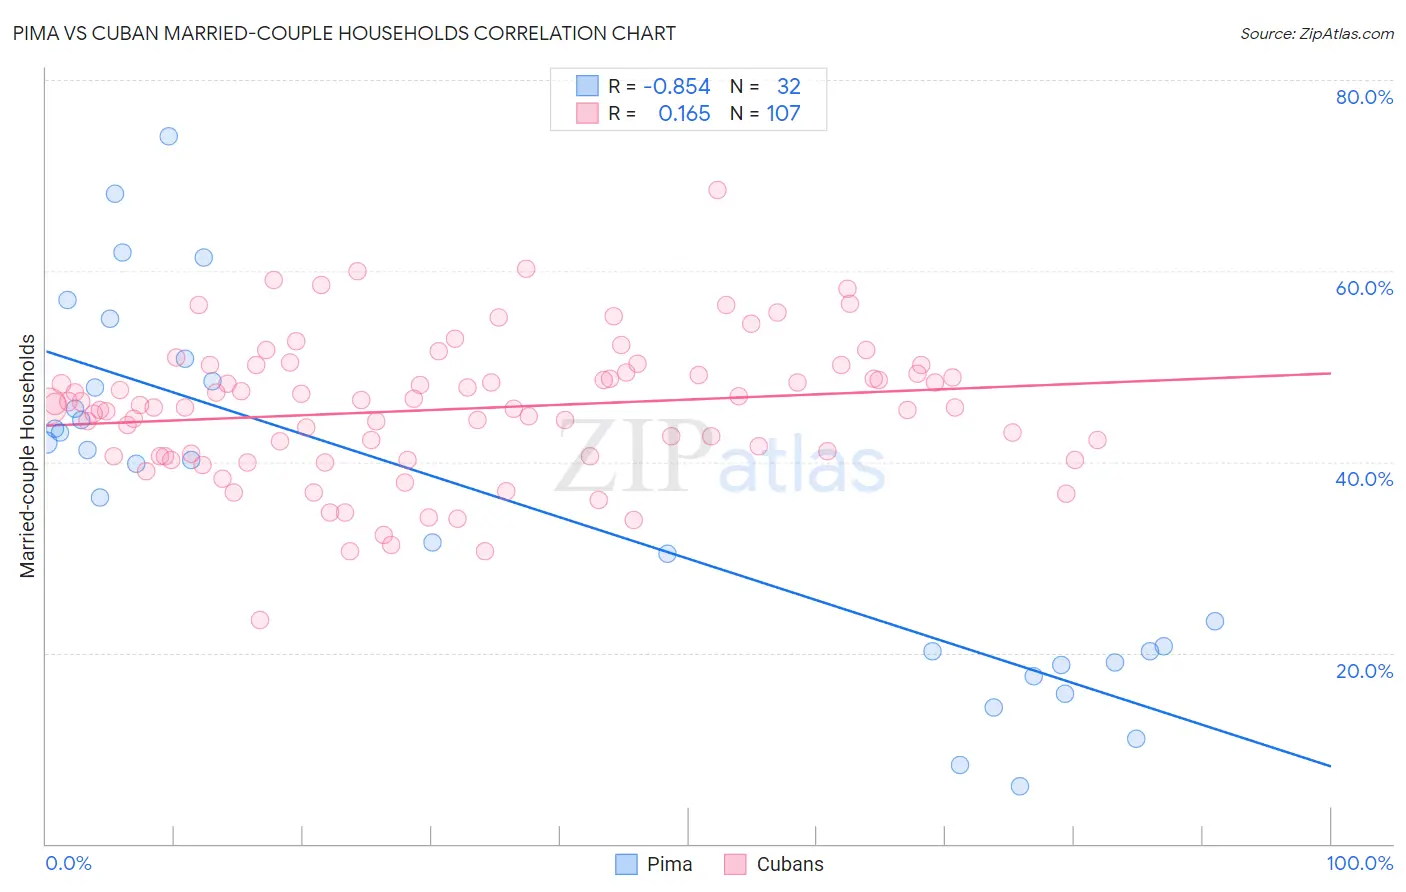
Pima vs Cuban Married-couple Households Correlation Chart
The statistical analysis conducted on geographies consisting of 61,538,795 people shows a very strong negative correlation between the proportion of Pima and percentage of married-couple family households in the United States with a correlation coefficient (R) of -0.854 and weighted average of 35.6%. Similarly, the statistical analysis conducted on geographies consisting of 448,946,522 people shows a poor positive correlation between the proportion of Cubans and percentage of married-couple family households in the United States with a correlation coefficient (R) of 0.165 and weighted average of 45.4%, a difference of 27.6%.
Married-couple Households Correlation Summary
| Measurement | Pima | Cuban |
| Minimum | 6.1% | 23.5% |
| Maximum | 74.1% | 68.4% |
| Range | 68.0% | 45.0% |
| Mean | 36.2% | 45.5% |
| Median | 40.0% | 45.8% |
| Interquartile 25% (IQ1) | 19.6% | 40.6% |
| Interquartile 75% (IQ3) | 48.1% | 49.4% |
| Interquartile Range (IQR) | 28.5% | 8.8% |
| Standard Deviation (Sample) | 18.4% | 7.3% |
| Standard Deviation (Population) | 18.1% | 7.3% |
Similar Demographics by Married-couple Households
Demographics Similar to Pima by Married-couple Households
In terms of married-couple households, the demographic groups most similar to Pima are Immigrants from Cabo Verde (36.2%, a difference of 1.9%), Hopi (36.7%, a difference of 3.2%), Immigrants from Dominican Republic (37.3%, a difference of 5.0%), Immigrants from Grenada (37.5%, a difference of 5.5%), and Tohono O'odham (37.9%, a difference of 6.6%).
| Demographics | Rating | Rank | Married-couple Households |
| Immigrants | West Indies | 0.0 /100 | #333 | Tragic 39.0% |
| Immigrants | St. Vincent and the Grenadines | 0.0 /100 | #334 | Tragic 38.7% |
| Senegalese | 0.0 /100 | #335 | Tragic 38.6% |
| Blacks/African Americans | 0.0 /100 | #336 | Tragic 38.5% |
| Immigrants | Somalia | 0.0 /100 | #337 | Tragic 38.4% |
| Immigrants | Senegal | 0.0 /100 | #338 | Tragic 38.4% |
| British West Indians | 0.0 /100 | #339 | Tragic 38.3% |
| Dominicans | 0.0 /100 | #340 | Tragic 38.2% |
| Cape Verdeans | 0.0 /100 | #341 | Tragic 38.1% |
| Tohono O'odham | 0.0 /100 | #342 | Tragic 37.9% |
| Immigrants | Grenada | 0.0 /100 | #343 | Tragic 37.5% |
| Immigrants | Dominican Republic | 0.0 /100 | #344 | Tragic 37.3% |
| Hopi | 0.0 /100 | #345 | Tragic 36.7% |
| Immigrants | Cabo Verde | 0.0 /100 | #346 | Tragic 36.2% |
| Pima | 0.0 /100 | #347 | Tragic 35.6% |
Demographics Similar to Cubans by Married-couple Households
In terms of married-couple households, the demographic groups most similar to Cubans are Immigrants from Spain (45.3%, a difference of 0.050%), Immigrants from Uzbekistan (45.4%, a difference of 0.090%), Hispanic or Latino (45.4%, a difference of 0.13%), Immigrants from France (45.4%, a difference of 0.14%), and Creek (45.3%, a difference of 0.18%).
| Demographics | Rating | Rank | Married-couple Households |
| Alaska Natives | 13.0 /100 | #203 | Poor 45.6% |
| Aleuts | 12.5 /100 | #204 | Poor 45.6% |
| Nepalese | 11.9 /100 | #205 | Poor 45.6% |
| Uruguayans | 10.4 /100 | #206 | Poor 45.5% |
| Immigrants | France | 8.8 /100 | #207 | Tragic 45.4% |
| Hispanics or Latinos | 8.7 /100 | #208 | Tragic 45.4% |
| Immigrants | Uzbekistan | 8.4 /100 | #209 | Tragic 45.4% |
| Cubans | 7.7 /100 | #210 | Tragic 45.4% |
| Immigrants | Spain | 7.3 /100 | #211 | Tragic 45.3% |
| Creek | 6.4 /100 | #212 | Tragic 45.3% |
| Yakama | 5.8 /100 | #213 | Tragic 45.2% |
| Japanese | 5.7 /100 | #214 | Tragic 45.2% |
| Immigrants | Nepal | 5.6 /100 | #215 | Tragic 45.2% |
| Immigrants | Portugal | 5.6 /100 | #216 | Tragic 45.2% |
| Panamanians | 5.5 /100 | #217 | Tragic 45.2% |