Immigrants from Fiji vs Assyrian/Chaldean/Syriac Married-couple Households
COMPARE
Immigrants from Fiji
Assyrian/Chaldean/Syriac
Married-couple Households
Married-couple Households Comparison
Immigrants from Fiji
Assyrians/Chaldeans/Syriacs
48.2%
MARRIED-COUPLE HOUSEHOLDS
98.4/ 100
METRIC RATING
76th/ 347
METRIC RANK
51.8%
MARRIED-COUPLE HOUSEHOLDS
100.0/ 100
METRIC RATING
4th/ 347
METRIC RANK
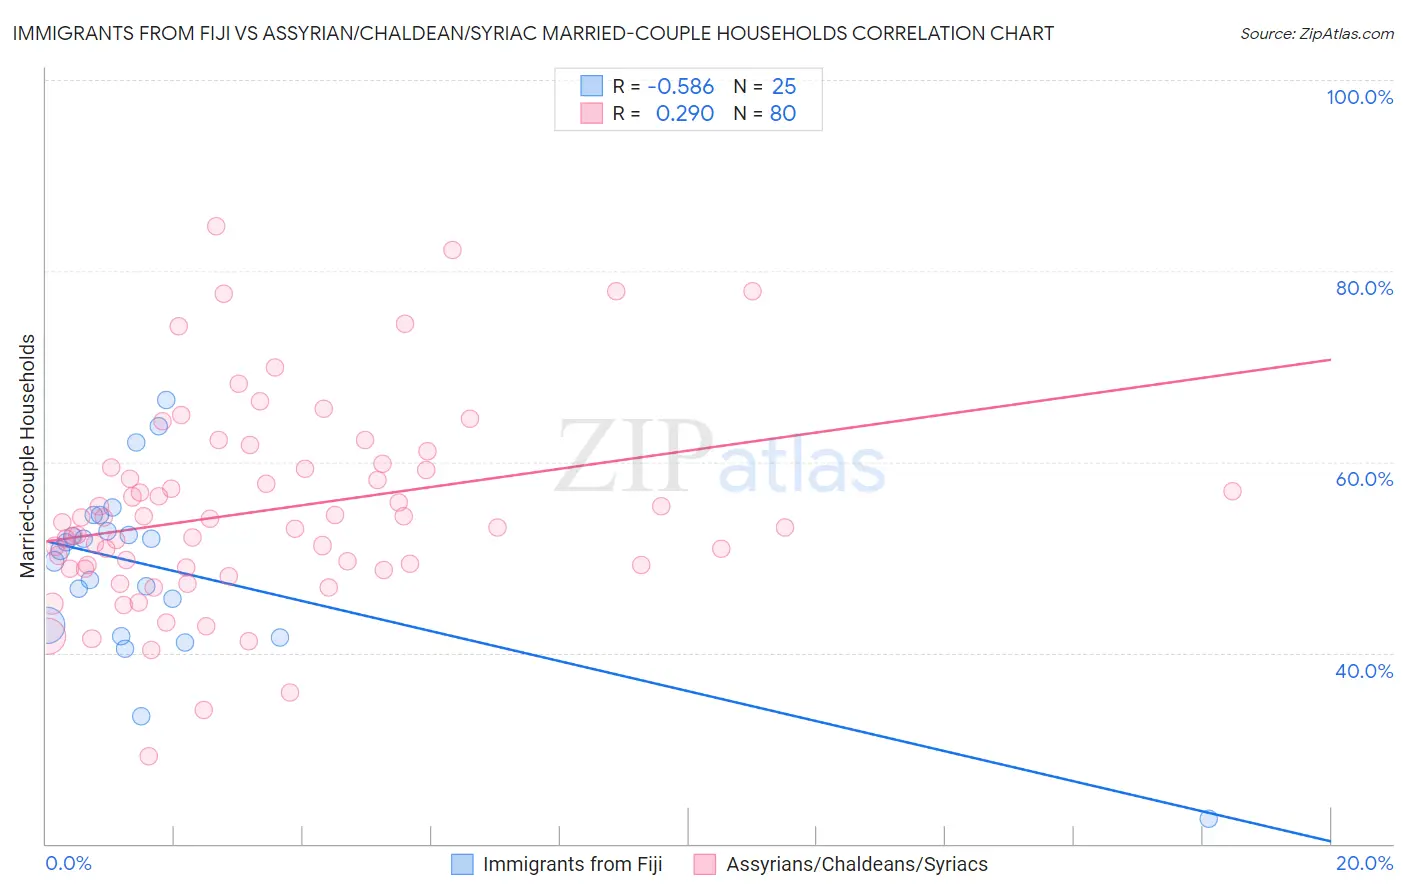
Immigrants from Fiji vs Assyrian/Chaldean/Syriac Married-couple Households Correlation Chart
The statistical analysis conducted on geographies consisting of 93,754,900 people shows a substantial negative correlation between the proportion of Immigrants from Fiji and percentage of married-couple family households in the United States with a correlation coefficient (R) of -0.586 and weighted average of 48.2%. Similarly, the statistical analysis conducted on geographies consisting of 110,294,582 people shows a weak positive correlation between the proportion of Assyrians/Chaldeans/Syriacs and percentage of married-couple family households in the United States with a correlation coefficient (R) of 0.290 and weighted average of 51.8%, a difference of 7.4%.
Married-couple Households Correlation Summary
| Measurement | Immigrants from Fiji | Assyrian/Chaldean/Syriac |
| Minimum | 22.7% | 29.2% |
| Maximum | 66.5% | 84.7% |
| Range | 43.8% | 55.5% |
| Mean | 48.8% | 54.9% |
| Median | 50.7% | 53.4% |
| Interquartile 25% (IQ1) | 42.3% | 48.9% |
| Interquartile 75% (IQ3) | 53.6% | 59.3% |
| Interquartile Range (IQR) | 11.2% | 10.4% |
| Standard Deviation (Sample) | 9.3% | 10.5% |
| Standard Deviation (Population) | 9.1% | 10.4% |
Similar Demographics by Married-couple Households
Demographics Similar to Immigrants from Fiji by Married-couple Households
In terms of married-couple households, the demographic groups most similar to Immigrants from Fiji are Immigrants from England (48.2%, a difference of 0.0%), Immigrants from Romania (48.3%, a difference of 0.090%), Immigrants from Singapore (48.3%, a difference of 0.10%), Canadian (48.2%, a difference of 0.10%), and Egyptian (48.2%, a difference of 0.12%).
| Demographics | Rating | Rank | Married-couple Households |
| Immigrants | China | 98.9 /100 | #69 | Exceptional 48.4% |
| Immigrants | North America | 98.9 /100 | #70 | Exceptional 48.4% |
| Laotians | 98.8 /100 | #71 | Exceptional 48.4% |
| Scotch-Irish | 98.6 /100 | #72 | Exceptional 48.3% |
| Immigrants | Singapore | 98.6 /100 | #73 | Exceptional 48.3% |
| Immigrants | Romania | 98.6 /100 | #74 | Exceptional 48.3% |
| Immigrants | England | 98.4 /100 | #75 | Exceptional 48.2% |
| Immigrants | Fiji | 98.4 /100 | #76 | Exceptional 48.2% |
| Canadians | 98.2 /100 | #77 | Exceptional 48.2% |
| Egyptians | 98.2 /100 | #78 | Exceptional 48.2% |
| Immigrants | Netherlands | 98.2 /100 | #79 | Exceptional 48.2% |
| Russians | 98.1 /100 | #80 | Exceptional 48.2% |
| Finns | 98.0 /100 | #81 | Exceptional 48.1% |
| Immigrants | Poland | 97.7 /100 | #82 | Exceptional 48.1% |
| Guamanians/Chamorros | 97.6 /100 | #83 | Exceptional 48.1% |
Demographics Similar to Assyrians/Chaldeans/Syriacs by Married-couple Households
In terms of married-couple households, the demographic groups most similar to Assyrians/Chaldeans/Syriacs are Thai (51.9%, a difference of 0.21%), Tongan (51.6%, a difference of 0.48%), Immigrants from Taiwan (52.4%, a difference of 1.2%), Danish (51.1%, a difference of 1.5%), and Filipino (51.0%, a difference of 1.7%).
| Demographics | Rating | Rank | Married-couple Households |
| Immigrants | India | 100.0 /100 | #1 | Exceptional 52.7% |
| Immigrants | Taiwan | 100.0 /100 | #2 | Exceptional 52.4% |
| Thais | 100.0 /100 | #3 | Exceptional 51.9% |
| Assyrians/Chaldeans/Syriacs | 100.0 /100 | #4 | Exceptional 51.8% |
| Tongans | 100.0 /100 | #5 | Exceptional 51.6% |
| Danes | 100.0 /100 | #6 | Exceptional 51.1% |
| Filipinos | 100.0 /100 | #7 | Exceptional 51.0% |
| Immigrants | South Central Asia | 100.0 /100 | #8 | Exceptional 50.6% |
| Pennsylvania Germans | 100.0 /100 | #9 | Exceptional 50.4% |
| Chinese | 100.0 /100 | #10 | Exceptional 50.4% |
| Immigrants | Pakistan | 100.0 /100 | #11 | Exceptional 50.1% |
| Swiss | 100.0 /100 | #12 | Exceptional 49.9% |
| Immigrants | Korea | 100.0 /100 | #13 | Exceptional 49.9% |
| Burmese | 100.0 /100 | #14 | Exceptional 49.8% |
| Koreans | 99.9 /100 | #15 | Exceptional 49.7% |