Immigrants from Belize vs Tsimshian Married-couple Households
COMPARE
Immigrants from Belize
Tsimshian
Married-couple Households
Married-couple Households Comparison
Immigrants from Belize
Tsimshian
41.8%
MARRIED-COUPLE HOUSEHOLDS
0.0/ 100
METRIC RATING
300th/ 347
METRIC RANK
48.7%
MARRIED-COUPLE HOUSEHOLDS
99.5/ 100
METRIC RATING
46th/ 347
METRIC RANK
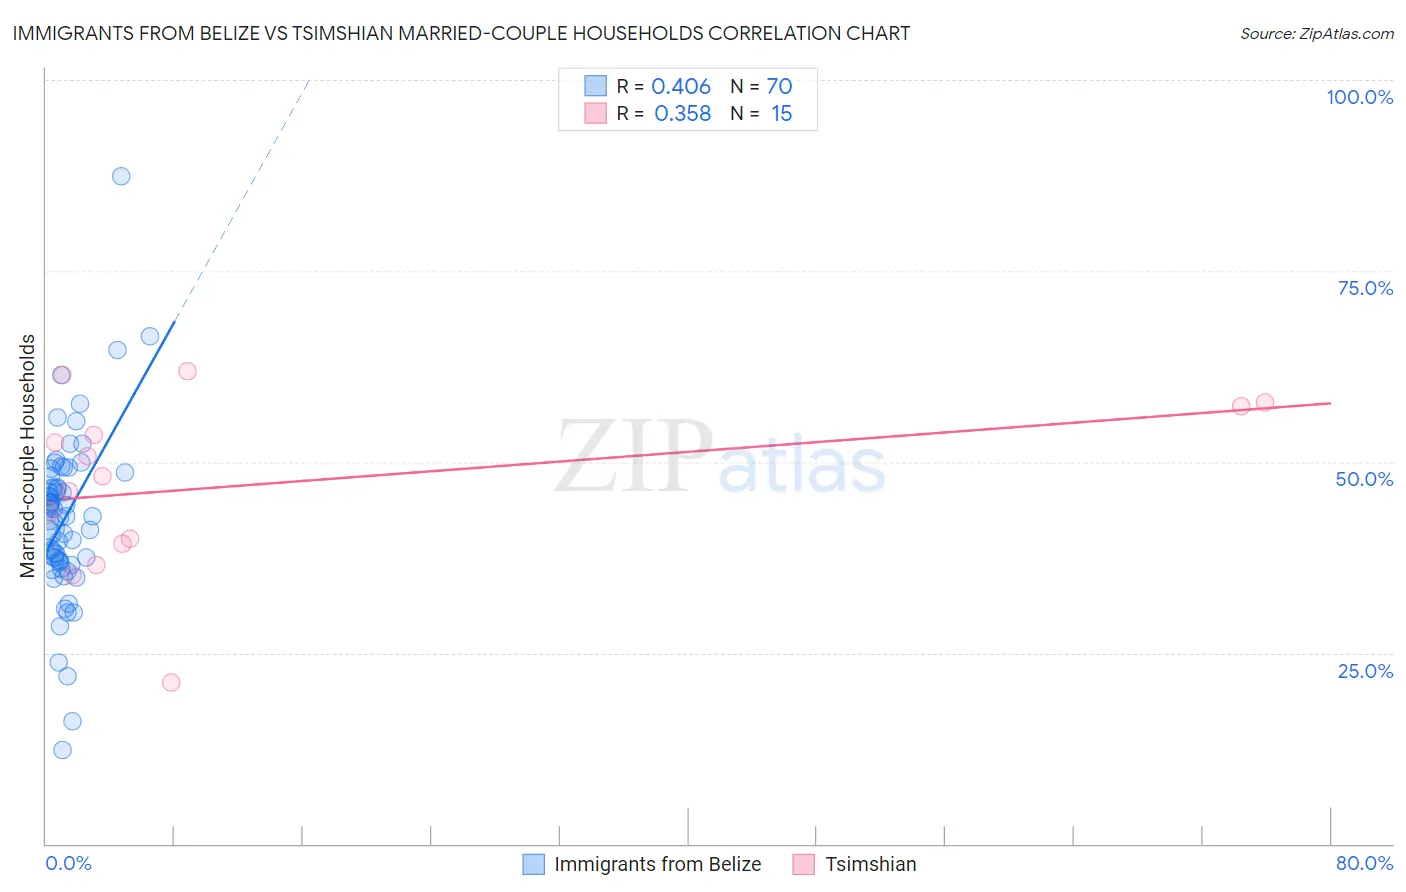
Immigrants from Belize vs Tsimshian Married-couple Households Correlation Chart
The statistical analysis conducted on geographies consisting of 130,286,340 people shows a moderate positive correlation between the proportion of Immigrants from Belize and percentage of married-couple family households in the United States with a correlation coefficient (R) of 0.406 and weighted average of 41.8%. Similarly, the statistical analysis conducted on geographies consisting of 15,626,544 people shows a mild positive correlation between the proportion of Tsimshian and percentage of married-couple family households in the United States with a correlation coefficient (R) of 0.358 and weighted average of 48.7%, a difference of 16.7%.
Married-couple Households Correlation Summary
| Measurement | Immigrants from Belize | Tsimshian |
| Minimum | 12.3% | 21.2% |
| Maximum | 87.4% | 61.9% |
| Range | 75.1% | 40.7% |
| Mean | 42.7% | 47.0% |
| Median | 42.9% | 48.2% |
| Interquartile 25% (IQ1) | 37.0% | 39.3% |
| Interquartile 75% (IQ3) | 48.1% | 57.3% |
| Interquartile Range (IQR) | 11.1% | 18.0% |
| Standard Deviation (Sample) | 11.1% | 11.3% |
| Standard Deviation (Population) | 11.0% | 10.9% |
Similar Demographics by Married-couple Households
Demographics Similar to Immigrants from Belize by Married-couple Households
In terms of married-couple households, the demographic groups most similar to Immigrants from Belize are Immigrants from Ghana (41.8%, a difference of 0.020%), Immigrants from Middle Africa (41.8%, a difference of 0.090%), Arapaho (41.8%, a difference of 0.13%), Immigrants from Bahamas (41.7%, a difference of 0.21%), and Immigrants from Honduras (41.6%, a difference of 0.38%).
| Demographics | Rating | Rank | Married-couple Households |
| Menominee | 0.0 /100 | #293 | Tragic 42.0% |
| Immigrants | Yemen | 0.0 /100 | #294 | Tragic 42.0% |
| Kiowa | 0.0 /100 | #295 | Tragic 42.0% |
| Immigrants | Sudan | 0.0 /100 | #296 | Tragic 41.9% |
| Arapaho | 0.0 /100 | #297 | Tragic 41.8% |
| Immigrants | Middle Africa | 0.0 /100 | #298 | Tragic 41.8% |
| Immigrants | Ghana | 0.0 /100 | #299 | Tragic 41.8% |
| Immigrants | Belize | 0.0 /100 | #300 | Tragic 41.8% |
| Immigrants | Bahamas | 0.0 /100 | #301 | Tragic 41.7% |
| Immigrants | Honduras | 0.0 /100 | #302 | Tragic 41.6% |
| Sub-Saharan Africans | 0.0 /100 | #303 | Tragic 41.6% |
| Immigrants | Guyana | 0.0 /100 | #304 | Tragic 41.6% |
| Sioux | 0.0 /100 | #305 | Tragic 41.5% |
| Guyanese | 0.0 /100 | #306 | Tragic 41.4% |
| Immigrants | Western Africa | 0.0 /100 | #307 | Tragic 41.4% |
Demographics Similar to Tsimshian by Married-couple Households
In terms of married-couple households, the demographic groups most similar to Tsimshian are British (48.7%, a difference of 0.020%), Immigrants from Eastern Asia (48.8%, a difference of 0.050%), Indian (Asian) (48.7%, a difference of 0.070%), Welsh (48.8%, a difference of 0.080%), and Immigrants from Iran (48.8%, a difference of 0.13%).
| Demographics | Rating | Rank | Married-couple Households |
| Lithuanians | 99.6 /100 | #39 | Exceptional 48.9% |
| Immigrants | Bolivia | 99.6 /100 | #40 | Exceptional 48.9% |
| Immigrants | Lebanon | 99.6 /100 | #41 | Exceptional 48.9% |
| Immigrants | Vietnam | 99.6 /100 | #42 | Exceptional 48.8% |
| Immigrants | Iran | 99.6 /100 | #43 | Exceptional 48.8% |
| Welsh | 99.5 /100 | #44 | Exceptional 48.8% |
| Immigrants | Eastern Asia | 99.5 /100 | #45 | Exceptional 48.8% |
| Tsimshian | 99.5 /100 | #46 | Exceptional 48.7% |
| British | 99.5 /100 | #47 | Exceptional 48.7% |
| Indians (Asian) | 99.4 /100 | #48 | Exceptional 48.7% |
| Immigrants | Sri Lanka | 99.4 /100 | #49 | Exceptional 48.7% |
| Samoans | 99.4 /100 | #50 | Exceptional 48.7% |
| Eastern Europeans | 99.3 /100 | #51 | Exceptional 48.6% |
| Irish | 99.3 /100 | #52 | Exceptional 48.6% |
| Whites/Caucasians | 99.3 /100 | #53 | Exceptional 48.6% |