Immigrants from Belize vs Croatian Married-couple Households
COMPARE
Immigrants from Belize
Croatian
Married-couple Households
Married-couple Households Comparison
Immigrants from Belize
Croatians
41.8%
MARRIED-COUPLE HOUSEHOLDS
0.0/ 100
METRIC RATING
300th/ 347
METRIC RANK
48.5%
MARRIED-COUPLE HOUSEHOLDS
99.1/ 100
METRIC RATING
60th/ 347
METRIC RANK
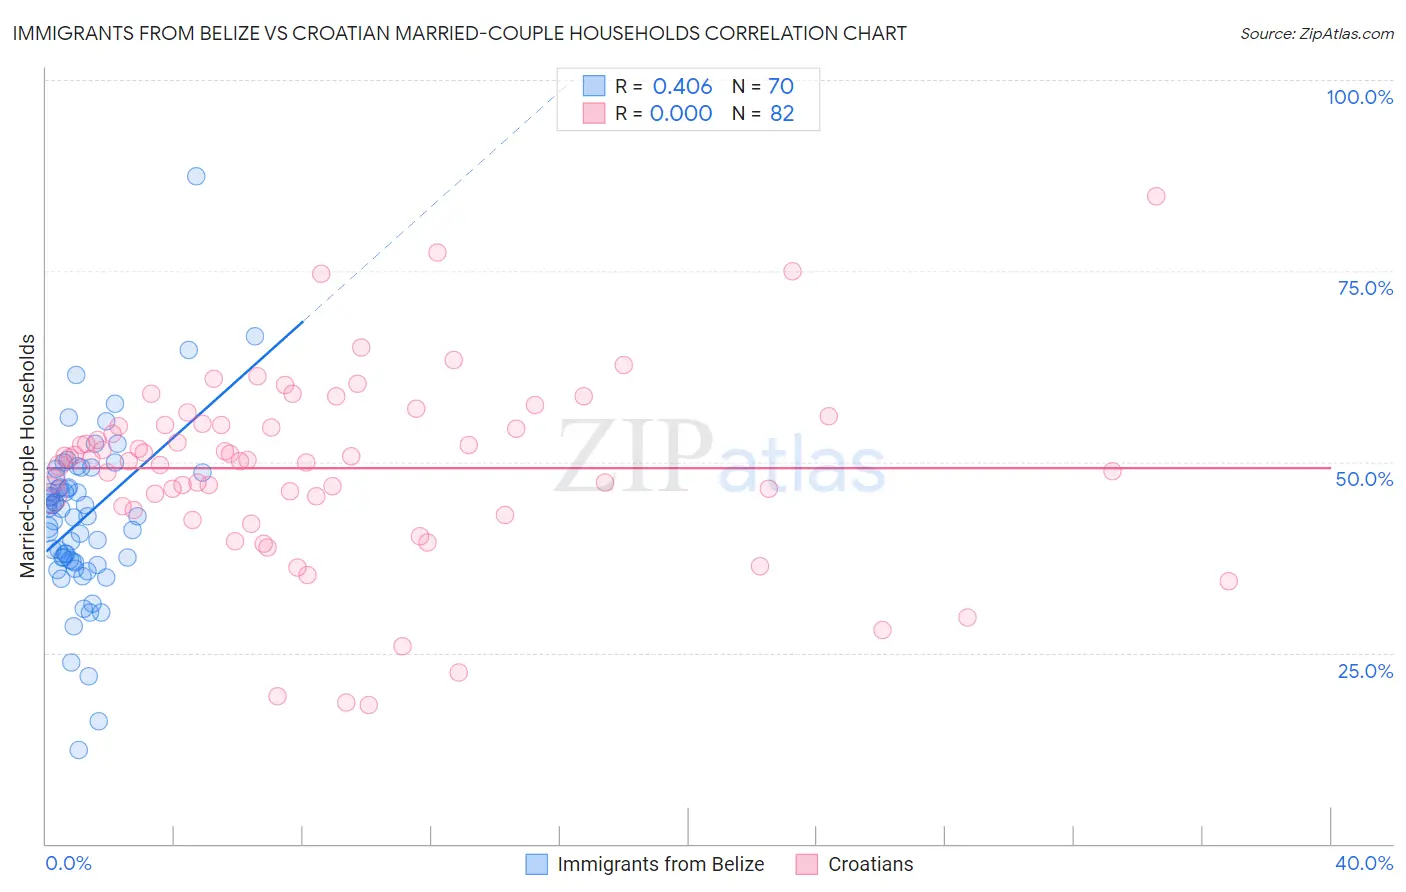
Immigrants from Belize vs Croatian Married-couple Households Correlation Chart
The statistical analysis conducted on geographies consisting of 130,286,340 people shows a moderate positive correlation between the proportion of Immigrants from Belize and percentage of married-couple family households in the United States with a correlation coefficient (R) of 0.406 and weighted average of 41.8%. Similarly, the statistical analysis conducted on geographies consisting of 375,518,925 people shows no correlation between the proportion of Croatians and percentage of married-couple family households in the United States with a correlation coefficient (R) of 0.000 and weighted average of 48.5%, a difference of 16.1%.
Married-couple Households Correlation Summary
| Measurement | Immigrants from Belize | Croatian |
| Minimum | 12.3% | 18.1% |
| Maximum | 87.4% | 84.8% |
| Range | 75.1% | 66.7% |
| Mean | 42.7% | 49.2% |
| Median | 42.9% | 50.4% |
| Interquartile 25% (IQ1) | 37.0% | 44.2% |
| Interquartile 75% (IQ3) | 48.1% | 54.8% |
| Interquartile Range (IQR) | 11.1% | 10.6% |
| Standard Deviation (Sample) | 11.1% | 12.1% |
| Standard Deviation (Population) | 11.0% | 12.0% |
Similar Demographics by Married-couple Households
Demographics Similar to Immigrants from Belize by Married-couple Households
In terms of married-couple households, the demographic groups most similar to Immigrants from Belize are Immigrants from Ghana (41.8%, a difference of 0.020%), Immigrants from Middle Africa (41.8%, a difference of 0.090%), Arapaho (41.8%, a difference of 0.13%), Immigrants from Bahamas (41.7%, a difference of 0.21%), and Immigrants from Honduras (41.6%, a difference of 0.38%).
| Demographics | Rating | Rank | Married-couple Households |
| Menominee | 0.0 /100 | #293 | Tragic 42.0% |
| Immigrants | Yemen | 0.0 /100 | #294 | Tragic 42.0% |
| Kiowa | 0.0 /100 | #295 | Tragic 42.0% |
| Immigrants | Sudan | 0.0 /100 | #296 | Tragic 41.9% |
| Arapaho | 0.0 /100 | #297 | Tragic 41.8% |
| Immigrants | Middle Africa | 0.0 /100 | #298 | Tragic 41.8% |
| Immigrants | Ghana | 0.0 /100 | #299 | Tragic 41.8% |
| Immigrants | Belize | 0.0 /100 | #300 | Tragic 41.8% |
| Immigrants | Bahamas | 0.0 /100 | #301 | Tragic 41.7% |
| Immigrants | Honduras | 0.0 /100 | #302 | Tragic 41.6% |
| Sub-Saharan Africans | 0.0 /100 | #303 | Tragic 41.6% |
| Immigrants | Guyana | 0.0 /100 | #304 | Tragic 41.6% |
| Sioux | 0.0 /100 | #305 | Tragic 41.5% |
| Guyanese | 0.0 /100 | #306 | Tragic 41.4% |
| Immigrants | Western Africa | 0.0 /100 | #307 | Tragic 41.4% |
Demographics Similar to Croatians by Married-couple Households
In terms of married-couple households, the demographic groups most similar to Croatians are Bulgarian (48.5%, a difference of 0.050%), Luxembourger (48.5%, a difference of 0.060%), Polish (48.5%, a difference of 0.080%), Immigrants from Indonesia (48.5%, a difference of 0.080%), and Czechoslovakian (48.5%, a difference of 0.080%).
| Demographics | Rating | Rank | Married-couple Households |
| Whites/Caucasians | 99.3 /100 | #53 | Exceptional 48.6% |
| Immigrants | Lithuania | 99.3 /100 | #54 | Exceptional 48.6% |
| Austrians | 99.3 /100 | #55 | Exceptional 48.6% |
| Immigrants | Northern Europe | 99.3 /100 | #56 | Exceptional 48.6% |
| Poles | 99.2 /100 | #57 | Exceptional 48.5% |
| Immigrants | Indonesia | 99.2 /100 | #58 | Exceptional 48.5% |
| Czechoslovakians | 99.2 /100 | #59 | Exceptional 48.5% |
| Croatians | 99.1 /100 | #60 | Exceptional 48.5% |
| Bulgarians | 99.1 /100 | #61 | Exceptional 48.5% |
| Luxembourgers | 99.1 /100 | #62 | Exceptional 48.5% |
| Basques | 99.0 /100 | #63 | Exceptional 48.4% |
| Northern Europeans | 99.0 /100 | #64 | Exceptional 48.4% |
| Immigrants | Canada | 99.0 /100 | #65 | Exceptional 48.4% |
| Jordanians | 98.9 /100 | #66 | Exceptional 48.4% |
| Romanians | 98.9 /100 | #67 | Exceptional 48.4% |