Immigrants from Western Europe vs Tsimshian Married-couple Households
COMPARE
Immigrants from Western Europe
Tsimshian
Married-couple Households
Married-couple Households Comparison
Immigrants from Western Europe
Tsimshian
47.1%
MARRIED-COUPLE HOUSEHOLDS
81.6/ 100
METRIC RATING
146th/ 347
METRIC RANK
48.7%
MARRIED-COUPLE HOUSEHOLDS
99.5/ 100
METRIC RATING
46th/ 347
METRIC RANK
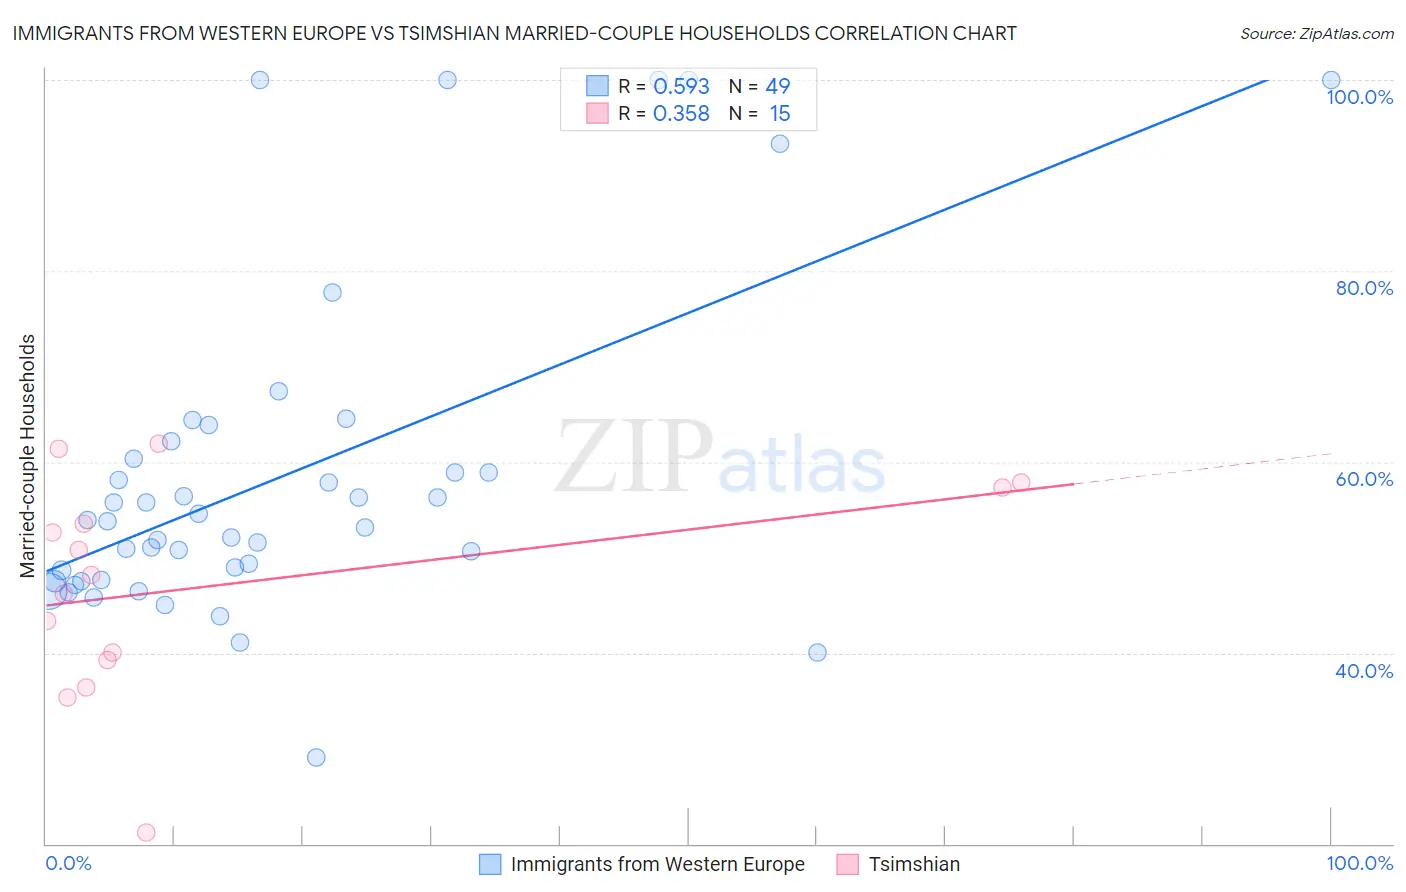
Immigrants from Western Europe vs Tsimshian Married-couple Households Correlation Chart
The statistical analysis conducted on geographies consisting of 493,807,996 people shows a substantial positive correlation between the proportion of Immigrants from Western Europe and percentage of married-couple family households in the United States with a correlation coefficient (R) of 0.593 and weighted average of 47.1%. Similarly, the statistical analysis conducted on geographies consisting of 15,626,544 people shows a mild positive correlation between the proportion of Tsimshian and percentage of married-couple family households in the United States with a correlation coefficient (R) of 0.358 and weighted average of 48.7%, a difference of 3.5%.
Married-couple Households Correlation Summary
| Measurement | Immigrants from Western Europe | Tsimshian |
| Minimum | 29.0% | 21.2% |
| Maximum | 100.0% | 61.9% |
| Range | 71.0% | 40.7% |
| Mean | 58.4% | 47.0% |
| Median | 53.7% | 48.2% |
| Interquartile 25% (IQ1) | 47.6% | 39.3% |
| Interquartile 75% (IQ3) | 61.3% | 57.3% |
| Interquartile Range (IQR) | 13.7% | 18.0% |
| Standard Deviation (Sample) | 17.2% | 11.3% |
| Standard Deviation (Population) | 17.0% | 10.9% |
Similar Demographics by Married-couple Households
Demographics Similar to Immigrants from Western Europe by Married-couple Households
In terms of married-couple households, the demographic groups most similar to Immigrants from Western Europe are Slovene (47.1%, a difference of 0.0%), Immigrants from Syria (47.1%, a difference of 0.0%), Mexican (47.1%, a difference of 0.12%), Icelander (47.0%, a difference of 0.13%), and Immigrants from Belarus (47.2%, a difference of 0.14%).
| Demographics | Rating | Rank | Married-couple Households |
| Immigrants | Sweden | 84.7 /100 | #139 | Excellent 47.2% |
| Spanish | 84.5 /100 | #140 | Excellent 47.2% |
| Costa Ricans | 84.4 /100 | #141 | Excellent 47.2% |
| Spaniards | 84.1 /100 | #142 | Excellent 47.2% |
| Immigrants | Belarus | 83.8 /100 | #143 | Excellent 47.2% |
| Mexicans | 83.4 /100 | #144 | Excellent 47.1% |
| Slovenes | 81.7 /100 | #145 | Excellent 47.1% |
| Immigrants | Western Europe | 81.6 /100 | #146 | Excellent 47.1% |
| Immigrants | Syria | 81.6 /100 | #147 | Excellent 47.1% |
| Icelanders | 79.5 /100 | #148 | Good 47.0% |
| Paraguayans | 78.7 /100 | #149 | Good 47.0% |
| Immigrants | Russia | 77.6 /100 | #150 | Good 47.0% |
| Immigrants | Bulgaria | 76.8 /100 | #151 | Good 47.0% |
| Serbians | 76.3 /100 | #152 | Good 47.0% |
| Hmong | 76.2 /100 | #153 | Good 47.0% |
Demographics Similar to Tsimshian by Married-couple Households
In terms of married-couple households, the demographic groups most similar to Tsimshian are British (48.7%, a difference of 0.020%), Immigrants from Eastern Asia (48.8%, a difference of 0.050%), Indian (Asian) (48.7%, a difference of 0.070%), Welsh (48.8%, a difference of 0.080%), and Immigrants from Iran (48.8%, a difference of 0.13%).
| Demographics | Rating | Rank | Married-couple Households |
| Lithuanians | 99.6 /100 | #39 | Exceptional 48.9% |
| Immigrants | Bolivia | 99.6 /100 | #40 | Exceptional 48.9% |
| Immigrants | Lebanon | 99.6 /100 | #41 | Exceptional 48.9% |
| Immigrants | Vietnam | 99.6 /100 | #42 | Exceptional 48.8% |
| Immigrants | Iran | 99.6 /100 | #43 | Exceptional 48.8% |
| Welsh | 99.5 /100 | #44 | Exceptional 48.8% |
| Immigrants | Eastern Asia | 99.5 /100 | #45 | Exceptional 48.8% |
| Tsimshian | 99.5 /100 | #46 | Exceptional 48.7% |
| British | 99.5 /100 | #47 | Exceptional 48.7% |
| Indians (Asian) | 99.4 /100 | #48 | Exceptional 48.7% |
| Immigrants | Sri Lanka | 99.4 /100 | #49 | Exceptional 48.7% |
| Samoans | 99.4 /100 | #50 | Exceptional 48.7% |
| Eastern Europeans | 99.3 /100 | #51 | Exceptional 48.6% |
| Irish | 99.3 /100 | #52 | Exceptional 48.6% |
| Whites/Caucasians | 99.3 /100 | #53 | Exceptional 48.6% |