Immigrants from Belize vs Tsimshian In Labor Force | Age 20-64
COMPARE
Immigrants from Belize
Tsimshian
In Labor Force | Age 20-64
In Labor Force | Age 20-64 Comparison
Immigrants from Belize
Tsimshian
78.0%
IN LABOR FORCE | AGE 20-64
0.0/ 100
METRIC RATING
286th/ 347
METRIC RANK
78.7%
IN LABOR FORCE | AGE 20-64
0.4/ 100
METRIC RATING
259th/ 347
METRIC RANK
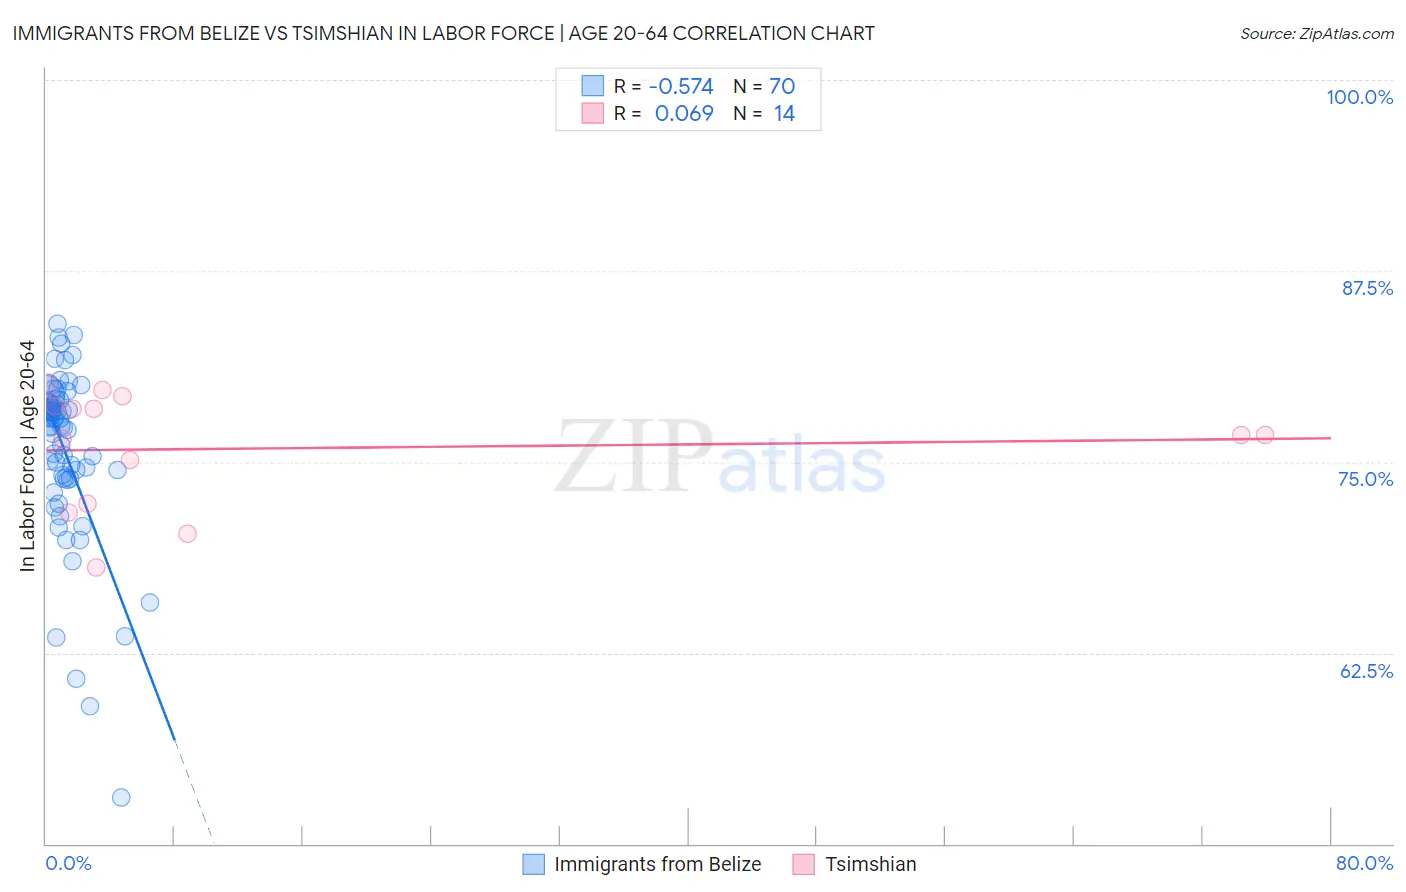
Immigrants from Belize vs Tsimshian In Labor Force | Age 20-64 Correlation Chart
The statistical analysis conducted on geographies consisting of 130,318,427 people shows a substantial negative correlation between the proportion of Immigrants from Belize and labor force participation rate among population between the ages 20 and 64 in the United States with a correlation coefficient (R) of -0.574 and weighted average of 78.0%. Similarly, the statistical analysis conducted on geographies consisting of 15,626,183 people shows a slight positive correlation between the proportion of Tsimshian and labor force participation rate among population between the ages 20 and 64 in the United States with a correlation coefficient (R) of 0.069 and weighted average of 78.7%, a difference of 0.89%.
In Labor Force | Age 20-64 Correlation Summary
| Measurement | Immigrants from Belize | Tsimshian |
| Minimum | 53.0% | 68.1% |
| Maximum | 84.0% | 80.1% |
| Range | 31.0% | 12.0% |
| Mean | 75.6% | 75.9% |
| Median | 77.3% | 76.8% |
| Interquartile 25% (IQ1) | 73.9% | 72.3% |
| Interquartile 75% (IQ3) | 78.8% | 78.7% |
| Interquartile Range (IQR) | 4.9% | 6.4% |
| Standard Deviation (Sample) | 5.8% | 3.8% |
| Standard Deviation (Population) | 5.7% | 3.7% |
Similar Demographics by In Labor Force | Age 20-64
Demographics Similar to Immigrants from Belize by In Labor Force | Age 20-64
In terms of in labor force | age 20-64, the demographic groups most similar to Immigrants from Belize are Vietnamese (78.0%, a difference of 0.0%), Osage (78.0%, a difference of 0.010%), Hmong (77.9%, a difference of 0.080%), African (77.9%, a difference of 0.090%), and Immigrants from Bangladesh (77.9%, a difference of 0.10%).
| Demographics | Rating | Rank | In Labor Force | Age 20-64 |
| Belizeans | 0.0 /100 | #279 | Tragic 78.2% |
| Immigrants | Dominica | 0.0 /100 | #280 | Tragic 78.1% |
| Guyanese | 0.0 /100 | #281 | Tragic 78.1% |
| Immigrants | St. Vincent and the Grenadines | 0.0 /100 | #282 | Tragic 78.1% |
| Immigrants | Nonimmigrants | 0.0 /100 | #283 | Tragic 78.1% |
| Immigrants | Guyana | 0.0 /100 | #284 | Tragic 78.1% |
| Osage | 0.0 /100 | #285 | Tragic 78.0% |
| Immigrants | Belize | 0.0 /100 | #286 | Tragic 78.0% |
| Vietnamese | 0.0 /100 | #287 | Tragic 78.0% |
| Hmong | 0.0 /100 | #288 | Tragic 77.9% |
| Africans | 0.0 /100 | #289 | Tragic 77.9% |
| Immigrants | Bangladesh | 0.0 /100 | #290 | Tragic 77.9% |
| Spanish Americans | 0.0 /100 | #291 | Tragic 77.8% |
| Immigrants | Azores | 0.0 /100 | #292 | Tragic 77.8% |
| Delaware | 0.0 /100 | #293 | Tragic 77.8% |
Demographics Similar to Tsimshian by In Labor Force | Age 20-64
In terms of in labor force | age 20-64, the demographic groups most similar to Tsimshian are Immigrants from Guatemala (78.7%, a difference of 0.030%), Guatemalan (78.7%, a difference of 0.040%), Hawaiian (78.7%, a difference of 0.050%), Celtic (78.7%, a difference of 0.050%), and Immigrants from Lebanon (78.7%, a difference of 0.070%).
| Demographics | Rating | Rank | In Labor Force | Age 20-64 |
| Immigrants | Honduras | 0.6 /100 | #252 | Tragic 78.7% |
| Basques | 0.5 /100 | #253 | Tragic 78.7% |
| Immigrants | Lebanon | 0.5 /100 | #254 | Tragic 78.7% |
| Hawaiians | 0.5 /100 | #255 | Tragic 78.7% |
| Celtics | 0.5 /100 | #256 | Tragic 78.7% |
| Guatemalans | 0.4 /100 | #257 | Tragic 78.7% |
| Immigrants | Guatemala | 0.4 /100 | #258 | Tragic 78.7% |
| Tsimshian | 0.4 /100 | #259 | Tragic 78.7% |
| Immigrants | Fiji | 0.3 /100 | #260 | Tragic 78.6% |
| Whites/Caucasians | 0.2 /100 | #261 | Tragic 78.5% |
| Fijians | 0.1 /100 | #262 | Tragic 78.4% |
| Pennsylvania Germans | 0.1 /100 | #263 | Tragic 78.4% |
| Spaniards | 0.1 /100 | #264 | Tragic 78.4% |
| British West Indians | 0.1 /100 | #265 | Tragic 78.4% |
| Bahamians | 0.1 /100 | #266 | Tragic 78.4% |