British vs Tsimshian Married-couple Households
COMPARE
British
Tsimshian
Married-couple Households
Married-couple Households Comparison
British
Tsimshian
48.7%
MARRIED-COUPLE HOUSEHOLDS
99.5/ 100
METRIC RATING
47th/ 347
METRIC RANK
48.7%
MARRIED-COUPLE HOUSEHOLDS
99.5/ 100
METRIC RATING
46th/ 347
METRIC RANK
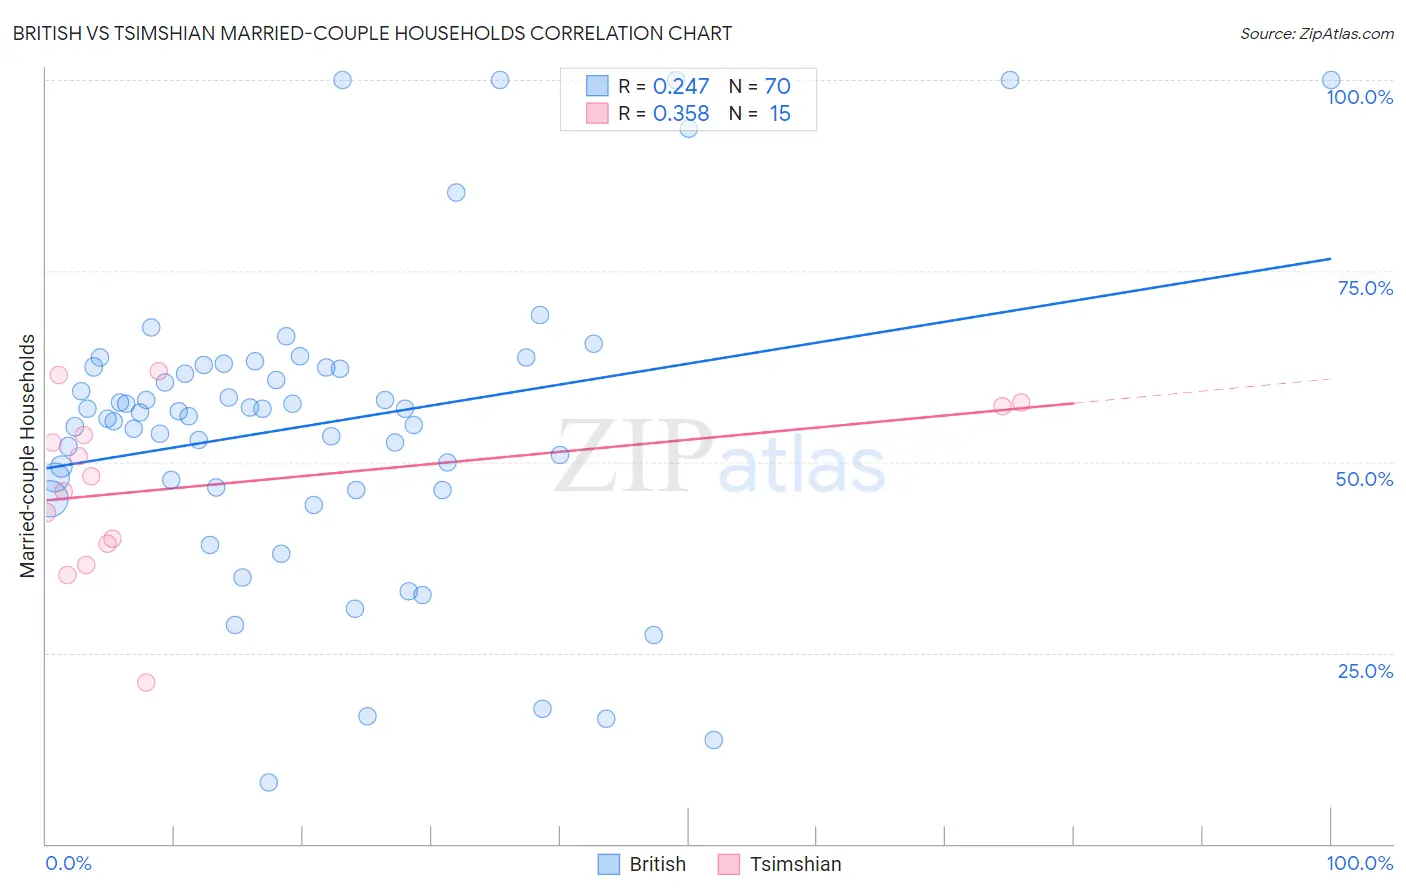
British vs Tsimshian Married-couple Households Correlation Chart
The statistical analysis conducted on geographies consisting of 530,976,365 people shows a weak positive correlation between the proportion of British and percentage of married-couple family households in the United States with a correlation coefficient (R) of 0.247 and weighted average of 48.7%. Similarly, the statistical analysis conducted on geographies consisting of 15,626,544 people shows a mild positive correlation between the proportion of Tsimshian and percentage of married-couple family households in the United States with a correlation coefficient (R) of 0.358 and weighted average of 48.7%, a difference of 0.020%.
Married-couple Households Correlation Summary
| Measurement | British | Tsimshian |
| Minimum | 8.1% | 21.2% |
| Maximum | 100.0% | 61.9% |
| Range | 91.9% | 40.7% |
| Mean | 55.0% | 47.0% |
| Median | 56.5% | 48.2% |
| Interquartile 25% (IQ1) | 46.7% | 39.3% |
| Interquartile 75% (IQ3) | 62.4% | 57.3% |
| Interquartile Range (IQR) | 15.8% | 18.0% |
| Standard Deviation (Sample) | 19.7% | 11.3% |
| Standard Deviation (Population) | 19.6% | 10.9% |
Demographics Similar to British and Tsimshian by Married-couple Households
In terms of married-couple households, the demographic groups most similar to British are Indian (Asian) (48.7%, a difference of 0.050%), Immigrants from Eastern Asia (48.8%, a difference of 0.060%), Welsh (48.8%, a difference of 0.10%), Immigrants from Sri Lanka (48.7%, a difference of 0.12%), and Immigrants from Iran (48.8%, a difference of 0.14%). Similarly, the demographic groups most similar to Tsimshian are Immigrants from Eastern Asia (48.8%, a difference of 0.050%), Indian (Asian) (48.7%, a difference of 0.070%), Welsh (48.8%, a difference of 0.080%), Immigrants from Iran (48.8%, a difference of 0.13%), and Immigrants from Sri Lanka (48.7%, a difference of 0.13%).
| Demographics | Rating | Rank | Married-couple Households |
| Iranians | 99.7 /100 | #36 | Exceptional 49.0% |
| Sri Lankans | 99.7 /100 | #37 | Exceptional 49.0% |
| Greeks | 99.7 /100 | #38 | Exceptional 48.9% |
| Lithuanians | 99.6 /100 | #39 | Exceptional 48.9% |
| Immigrants | Bolivia | 99.6 /100 | #40 | Exceptional 48.9% |
| Immigrants | Lebanon | 99.6 /100 | #41 | Exceptional 48.9% |
| Immigrants | Vietnam | 99.6 /100 | #42 | Exceptional 48.8% |
| Immigrants | Iran | 99.6 /100 | #43 | Exceptional 48.8% |
| Welsh | 99.5 /100 | #44 | Exceptional 48.8% |
| Immigrants | Eastern Asia | 99.5 /100 | #45 | Exceptional 48.8% |
| Tsimshian | 99.5 /100 | #46 | Exceptional 48.7% |
| British | 99.5 /100 | #47 | Exceptional 48.7% |
| Indians (Asian) | 99.4 /100 | #48 | Exceptional 48.7% |
| Immigrants | Sri Lanka | 99.4 /100 | #49 | Exceptional 48.7% |
| Samoans | 99.4 /100 | #50 | Exceptional 48.7% |
| Eastern Europeans | 99.3 /100 | #51 | Exceptional 48.6% |
| Irish | 99.3 /100 | #52 | Exceptional 48.6% |
| Whites/Caucasians | 99.3 /100 | #53 | Exceptional 48.6% |
| Immigrants | Lithuania | 99.3 /100 | #54 | Exceptional 48.6% |
| Austrians | 99.3 /100 | #55 | Exceptional 48.6% |
| Immigrants | Northern Europe | 99.3 /100 | #56 | Exceptional 48.6% |