Immigrants from Belize vs Shoshone Married-couple Households
COMPARE
Immigrants from Belize
Shoshone
Married-couple Households
Married-couple Households Comparison
Immigrants from Belize
Shoshone
41.8%
MARRIED-COUPLE HOUSEHOLDS
0.0/ 100
METRIC RATING
300th/ 347
METRIC RANK
43.9%
MARRIED-COUPLE HOUSEHOLDS
0.3/ 100
METRIC RATING
255th/ 347
METRIC RANK
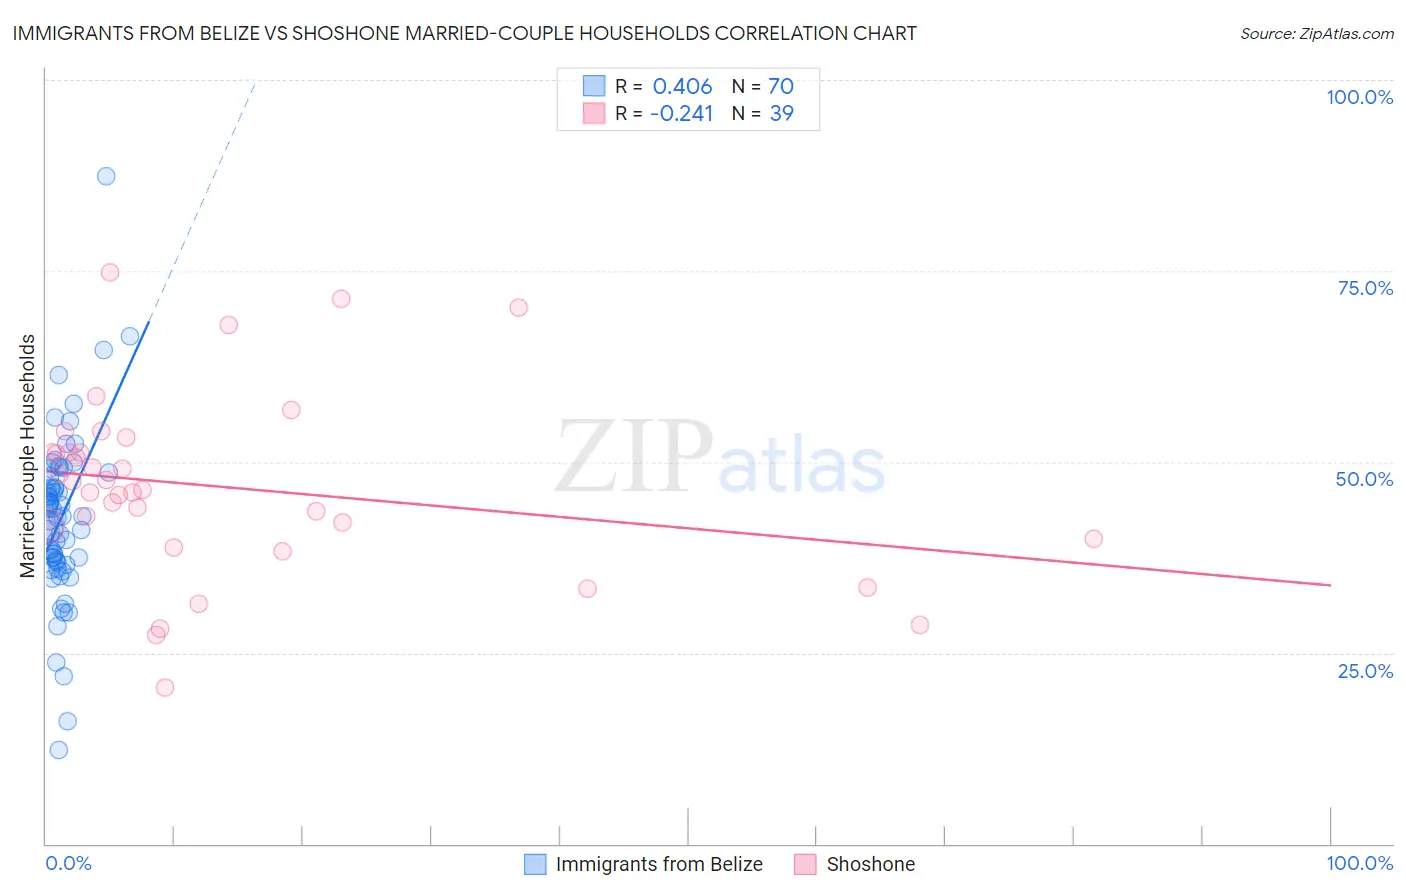
Immigrants from Belize vs Shoshone Married-couple Households Correlation Chart
The statistical analysis conducted on geographies consisting of 130,286,340 people shows a moderate positive correlation between the proportion of Immigrants from Belize and percentage of married-couple family households in the United States with a correlation coefficient (R) of 0.406 and weighted average of 41.8%. Similarly, the statistical analysis conducted on geographies consisting of 66,615,808 people shows a weak negative correlation between the proportion of Shoshone and percentage of married-couple family households in the United States with a correlation coefficient (R) of -0.241 and weighted average of 43.9%, a difference of 5.1%.
Married-couple Households Correlation Summary
| Measurement | Immigrants from Belize | Shoshone |
| Minimum | 12.3% | 20.5% |
| Maximum | 87.4% | 74.8% |
| Range | 75.1% | 54.3% |
| Mean | 42.7% | 46.7% |
| Median | 42.9% | 46.4% |
| Interquartile 25% (IQ1) | 37.0% | 40.0% |
| Interquartile 75% (IQ3) | 48.1% | 51.3% |
| Interquartile Range (IQR) | 11.1% | 11.3% |
| Standard Deviation (Sample) | 11.1% | 12.0% |
| Standard Deviation (Population) | 11.0% | 11.9% |
Similar Demographics by Married-couple Households
Demographics Similar to Immigrants from Belize by Married-couple Households
In terms of married-couple households, the demographic groups most similar to Immigrants from Belize are Immigrants from Ghana (41.8%, a difference of 0.020%), Immigrants from Middle Africa (41.8%, a difference of 0.090%), Arapaho (41.8%, a difference of 0.13%), Immigrants from Bahamas (41.7%, a difference of 0.21%), and Immigrants from Honduras (41.6%, a difference of 0.38%).
| Demographics | Rating | Rank | Married-couple Households |
| Menominee | 0.0 /100 | #293 | Tragic 42.0% |
| Immigrants | Yemen | 0.0 /100 | #294 | Tragic 42.0% |
| Kiowa | 0.0 /100 | #295 | Tragic 42.0% |
| Immigrants | Sudan | 0.0 /100 | #296 | Tragic 41.9% |
| Arapaho | 0.0 /100 | #297 | Tragic 41.8% |
| Immigrants | Middle Africa | 0.0 /100 | #298 | Tragic 41.8% |
| Immigrants | Ghana | 0.0 /100 | #299 | Tragic 41.8% |
| Immigrants | Belize | 0.0 /100 | #300 | Tragic 41.8% |
| Immigrants | Bahamas | 0.0 /100 | #301 | Tragic 41.7% |
| Immigrants | Honduras | 0.0 /100 | #302 | Tragic 41.6% |
| Sub-Saharan Africans | 0.0 /100 | #303 | Tragic 41.6% |
| Immigrants | Guyana | 0.0 /100 | #304 | Tragic 41.6% |
| Sioux | 0.0 /100 | #305 | Tragic 41.5% |
| Guyanese | 0.0 /100 | #306 | Tragic 41.4% |
| Immigrants | Western Africa | 0.0 /100 | #307 | Tragic 41.4% |
Demographics Similar to Shoshone by Married-couple Households
In terms of married-couple households, the demographic groups most similar to Shoshone are Apache (43.9%, a difference of 0.020%), Central American (43.9%, a difference of 0.070%), Ugandan (43.8%, a difference of 0.14%), Seminole (44.0%, a difference of 0.19%), and German Russian (44.0%, a difference of 0.26%).
| Demographics | Rating | Rank | Married-couple Households |
| Yup'ik | 0.4 /100 | #248 | Tragic 44.1% |
| Immigrants | Kenya | 0.4 /100 | #249 | Tragic 44.1% |
| French American Indians | 0.4 /100 | #250 | Tragic 44.1% |
| German Russians | 0.4 /100 | #251 | Tragic 44.0% |
| Seminole | 0.4 /100 | #252 | Tragic 44.0% |
| Central Americans | 0.3 /100 | #253 | Tragic 43.9% |
| Apache | 0.3 /100 | #254 | Tragic 43.9% |
| Shoshone | 0.3 /100 | #255 | Tragic 43.9% |
| Ugandans | 0.3 /100 | #256 | Tragic 43.8% |
| Blackfeet | 0.2 /100 | #257 | Tragic 43.8% |
| Central American Indians | 0.2 /100 | #258 | Tragic 43.8% |
| Iroquois | 0.2 /100 | #259 | Tragic 43.7% |
| Immigrants | Cameroon | 0.2 /100 | #260 | Tragic 43.7% |
| Alaskan Athabascans | 0.2 /100 | #261 | Tragic 43.6% |
| Vietnamese | 0.2 /100 | #262 | Tragic 43.6% |