British vs Croatian Married-couple Households
COMPARE
British
Croatian
Married-couple Households
Married-couple Households Comparison
British
Croatians
48.7%
MARRIED-COUPLE HOUSEHOLDS
99.5/ 100
METRIC RATING
47th/ 347
METRIC RANK
48.5%
MARRIED-COUPLE HOUSEHOLDS
99.1/ 100
METRIC RATING
60th/ 347
METRIC RANK
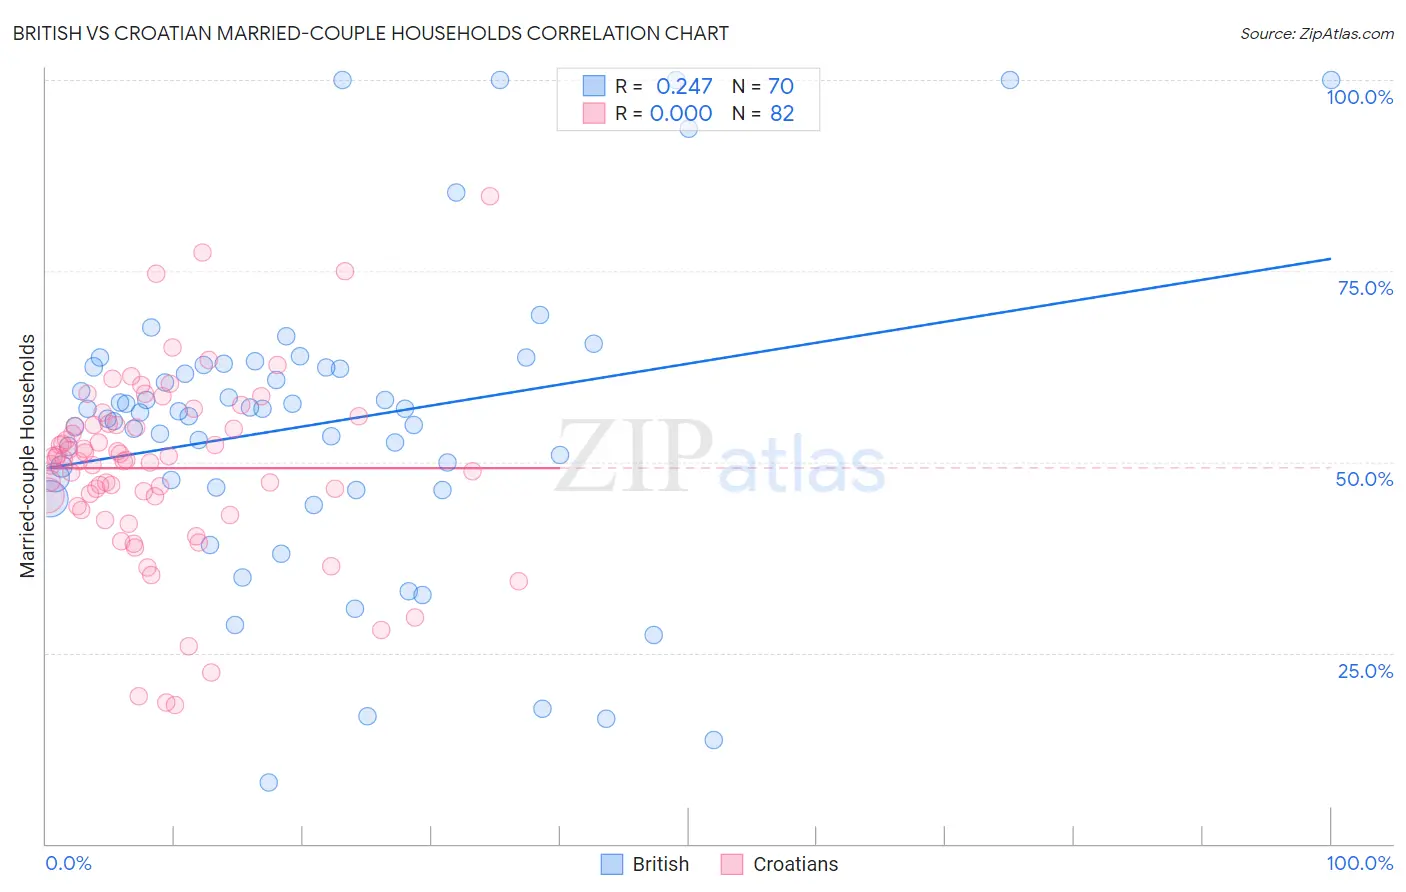
British vs Croatian Married-couple Households Correlation Chart
The statistical analysis conducted on geographies consisting of 530,976,365 people shows a weak positive correlation between the proportion of British and percentage of married-couple family households in the United States with a correlation coefficient (R) of 0.247 and weighted average of 48.7%. Similarly, the statistical analysis conducted on geographies consisting of 375,518,925 people shows no correlation between the proportion of Croatians and percentage of married-couple family households in the United States with a correlation coefficient (R) of 0.000 and weighted average of 48.5%, a difference of 0.47%.
Married-couple Households Correlation Summary
| Measurement | British | Croatian |
| Minimum | 8.1% | 18.1% |
| Maximum | 100.0% | 84.8% |
| Range | 91.9% | 66.7% |
| Mean | 55.0% | 49.2% |
| Median | 56.5% | 50.4% |
| Interquartile 25% (IQ1) | 46.7% | 44.2% |
| Interquartile 75% (IQ3) | 62.4% | 54.8% |
| Interquartile Range (IQR) | 15.8% | 10.6% |
| Standard Deviation (Sample) | 19.7% | 12.1% |
| Standard Deviation (Population) | 19.6% | 12.0% |
Demographics Similar to British and Croatians by Married-couple Households
In terms of married-couple households, the demographic groups most similar to British are Tsimshian (48.7%, a difference of 0.020%), Indian (Asian) (48.7%, a difference of 0.050%), Immigrants from Eastern Asia (48.8%, a difference of 0.060%), Welsh (48.8%, a difference of 0.10%), and Immigrants from Sri Lanka (48.7%, a difference of 0.12%). Similarly, the demographic groups most similar to Croatians are Bulgarian (48.5%, a difference of 0.050%), Luxembourger (48.5%, a difference of 0.060%), Polish (48.5%, a difference of 0.080%), Immigrants from Indonesia (48.5%, a difference of 0.080%), and Czechoslovakian (48.5%, a difference of 0.080%).
| Demographics | Rating | Rank | Married-couple Households |
| Immigrants | Iran | 99.6 /100 | #43 | Exceptional 48.8% |
| Welsh | 99.5 /100 | #44 | Exceptional 48.8% |
| Immigrants | Eastern Asia | 99.5 /100 | #45 | Exceptional 48.8% |
| Tsimshian | 99.5 /100 | #46 | Exceptional 48.7% |
| British | 99.5 /100 | #47 | Exceptional 48.7% |
| Indians (Asian) | 99.4 /100 | #48 | Exceptional 48.7% |
| Immigrants | Sri Lanka | 99.4 /100 | #49 | Exceptional 48.7% |
| Samoans | 99.4 /100 | #50 | Exceptional 48.7% |
| Eastern Europeans | 99.3 /100 | #51 | Exceptional 48.6% |
| Irish | 99.3 /100 | #52 | Exceptional 48.6% |
| Whites/Caucasians | 99.3 /100 | #53 | Exceptional 48.6% |
| Immigrants | Lithuania | 99.3 /100 | #54 | Exceptional 48.6% |
| Austrians | 99.3 /100 | #55 | Exceptional 48.6% |
| Immigrants | Northern Europe | 99.3 /100 | #56 | Exceptional 48.6% |
| Poles | 99.2 /100 | #57 | Exceptional 48.5% |
| Immigrants | Indonesia | 99.2 /100 | #58 | Exceptional 48.5% |
| Czechoslovakians | 99.2 /100 | #59 | Exceptional 48.5% |
| Croatians | 99.1 /100 | #60 | Exceptional 48.5% |
| Bulgarians | 99.1 /100 | #61 | Exceptional 48.5% |
| Luxembourgers | 99.1 /100 | #62 | Exceptional 48.5% |
| Basques | 99.0 /100 | #63 | Exceptional 48.4% |