Guyanese vs New Zealander Married-couple Households
COMPARE
Guyanese
New Zealander
Married-couple Households
Married-couple Households Comparison
Guyanese
New Zealanders
41.4%
MARRIED-COUPLE HOUSEHOLDS
0.0/ 100
METRIC RATING
306th/ 347
METRIC RANK
47.2%
MARRIED-COUPLE HOUSEHOLDS
85.3/ 100
METRIC RATING
136th/ 347
METRIC RANK
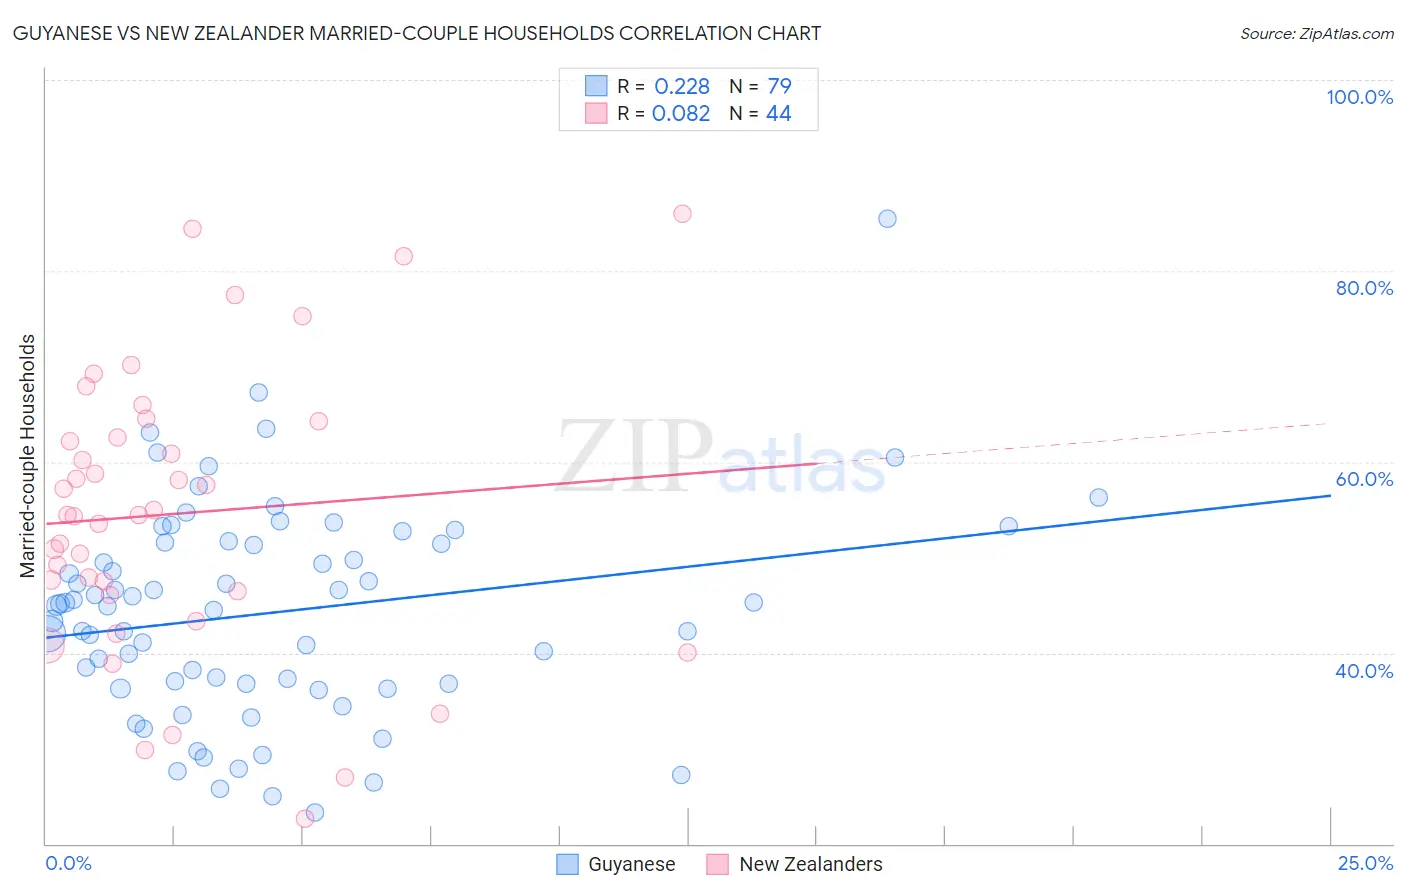
Guyanese vs New Zealander Married-couple Households Correlation Chart
The statistical analysis conducted on geographies consisting of 176,795,479 people shows a weak positive correlation between the proportion of Guyanese and percentage of married-couple family households in the United States with a correlation coefficient (R) of 0.228 and weighted average of 41.4%. Similarly, the statistical analysis conducted on geographies consisting of 106,894,441 people shows a slight positive correlation between the proportion of New Zealanders and percentage of married-couple family households in the United States with a correlation coefficient (R) of 0.082 and weighted average of 47.2%, a difference of 14.1%.
Married-couple Households Correlation Summary
| Measurement | Guyanese | New Zealander |
| Minimum | 23.3% | 22.7% |
| Maximum | 85.4% | 86.0% |
| Range | 62.2% | 63.3% |
| Mean | 44.2% | 54.6% |
| Median | 45.0% | 54.4% |
| Interquartile 25% (IQ1) | 36.8% | 46.3% |
| Interquartile 75% (IQ3) | 51.5% | 63.4% |
| Interquartile Range (IQR) | 14.7% | 17.2% |
| Standard Deviation (Sample) | 11.1% | 14.8% |
| Standard Deviation (Population) | 11.0% | 14.6% |
Similar Demographics by Married-couple Households
Demographics Similar to Guyanese by Married-couple Households
In terms of married-couple households, the demographic groups most similar to Guyanese are Immigrants from Western Africa (41.4%, a difference of 0.010%), Crow (41.4%, a difference of 0.010%), Immigrants from Trinidad and Tobago (41.2%, a difference of 0.36%), Sioux (41.5%, a difference of 0.37%), and Haitian (41.2%, a difference of 0.44%).
| Demographics | Rating | Rank | Married-couple Households |
| Immigrants | Ghana | 0.0 /100 | #299 | Tragic 41.8% |
| Immigrants | Belize | 0.0 /100 | #300 | Tragic 41.8% |
| Immigrants | Bahamas | 0.0 /100 | #301 | Tragic 41.7% |
| Immigrants | Honduras | 0.0 /100 | #302 | Tragic 41.6% |
| Sub-Saharan Africans | 0.0 /100 | #303 | Tragic 41.6% |
| Immigrants | Guyana | 0.0 /100 | #304 | Tragic 41.6% |
| Sioux | 0.0 /100 | #305 | Tragic 41.5% |
| Guyanese | 0.0 /100 | #306 | Tragic 41.4% |
| Immigrants | Western Africa | 0.0 /100 | #307 | Tragic 41.4% |
| Crow | 0.0 /100 | #308 | Tragic 41.4% |
| Immigrants | Trinidad and Tobago | 0.0 /100 | #309 | Tragic 41.2% |
| Haitians | 0.0 /100 | #310 | Tragic 41.2% |
| Colville | 0.0 /100 | #311 | Tragic 41.0% |
| Africans | 0.0 /100 | #312 | Tragic 40.9% |
| Immigrants | Haiti | 0.0 /100 | #313 | Tragic 40.9% |
Demographics Similar to New Zealanders by Married-couple Households
In terms of married-couple households, the demographic groups most similar to New Zealanders are Immigrants from Malaysia (47.2%, a difference of 0.0%), Immigrants from Afghanistan (47.2%, a difference of 0.010%), Immigrants from Sweden (47.2%, a difference of 0.040%), Immigrants from Greece (47.2%, a difference of 0.050%), and Immigrants from Argentina (47.2%, a difference of 0.050%).
| Demographics | Rating | Rank | Married-couple Households |
| Immigrants | Iraq | 87.8 /100 | #129 | Excellent 47.3% |
| Immigrants | Hungary | 87.8 /100 | #130 | Excellent 47.3% |
| Immigrants | Denmark | 87.5 /100 | #131 | Excellent 47.3% |
| Immigrants | Ukraine | 86.7 /100 | #132 | Excellent 47.3% |
| South Africans | 86.4 /100 | #133 | Excellent 47.3% |
| Immigrants | Greece | 86.0 /100 | #134 | Excellent 47.2% |
| Immigrants | Argentina | 86.0 /100 | #135 | Excellent 47.2% |
| New Zealanders | 85.3 /100 | #136 | Excellent 47.2% |
| Immigrants | Malaysia | 85.2 /100 | #137 | Excellent 47.2% |
| Immigrants | Afghanistan | 85.1 /100 | #138 | Excellent 47.2% |
| Immigrants | Sweden | 84.7 /100 | #139 | Excellent 47.2% |
| Spanish | 84.5 /100 | #140 | Excellent 47.2% |
| Costa Ricans | 84.4 /100 | #141 | Excellent 47.2% |
| Spaniards | 84.1 /100 | #142 | Excellent 47.2% |
| Immigrants | Belarus | 83.8 /100 | #143 | Excellent 47.2% |