Guyanese vs Armenian Married-couple Households
COMPARE
Guyanese
Armenian
Married-couple Households
Married-couple Households Comparison
Guyanese
Armenians
41.4%
MARRIED-COUPLE HOUSEHOLDS
0.0/ 100
METRIC RATING
306th/ 347
METRIC RANK
46.9%
MARRIED-COUPLE HOUSEHOLDS
75.4/ 100
METRIC RATING
156th/ 347
METRIC RANK
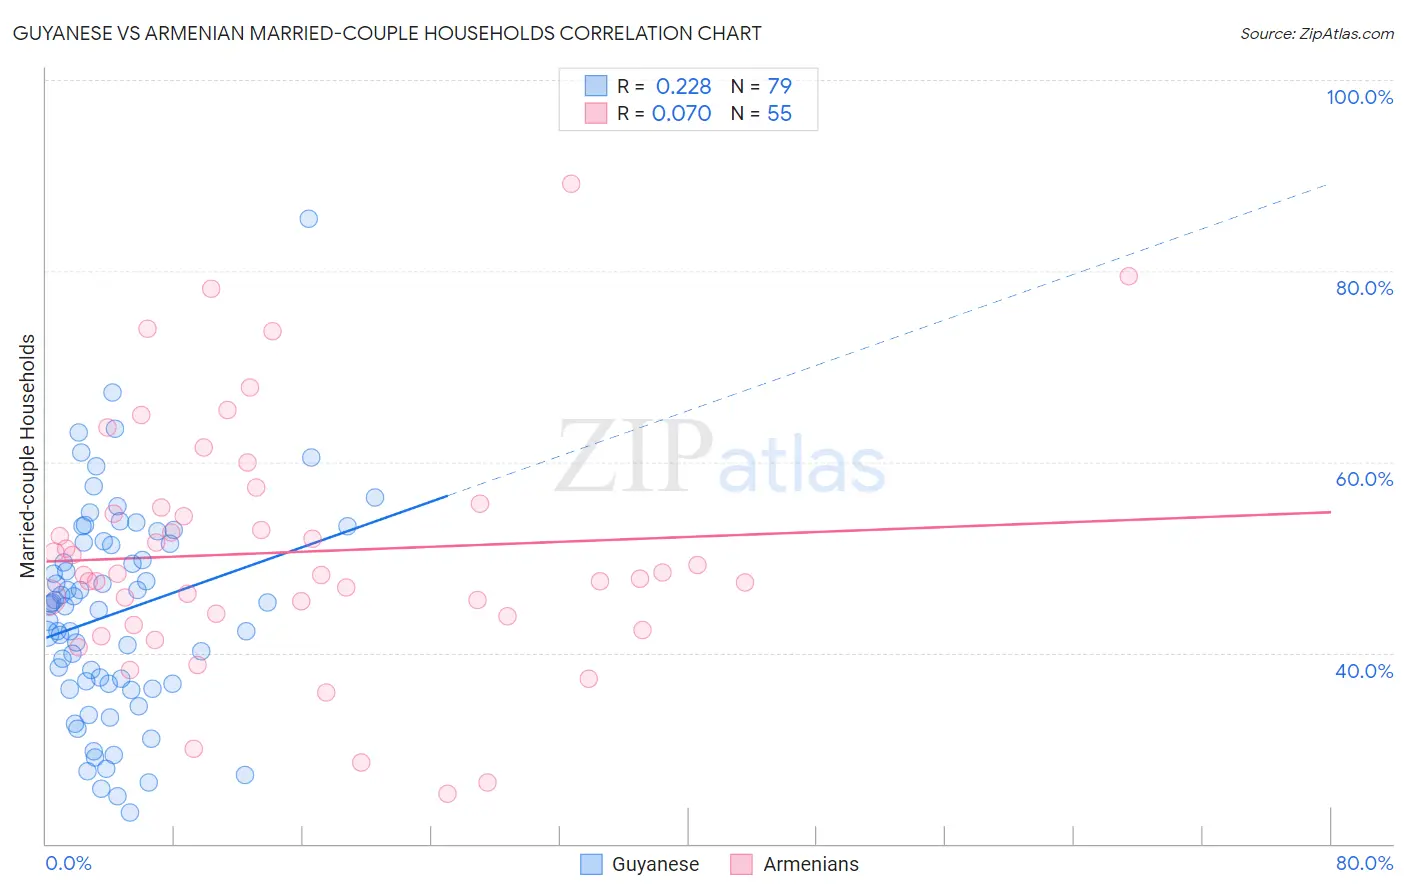
Guyanese vs Armenian Married-couple Households Correlation Chart
The statistical analysis conducted on geographies consisting of 176,795,479 people shows a weak positive correlation between the proportion of Guyanese and percentage of married-couple family households in the United States with a correlation coefficient (R) of 0.228 and weighted average of 41.4%. Similarly, the statistical analysis conducted on geographies consisting of 310,765,570 people shows a slight positive correlation between the proportion of Armenians and percentage of married-couple family households in the United States with a correlation coefficient (R) of 0.070 and weighted average of 46.9%, a difference of 13.5%.
Married-couple Households Correlation Summary
| Measurement | Guyanese | Armenian |
| Minimum | 23.3% | 25.2% |
| Maximum | 85.4% | 89.1% |
| Range | 62.2% | 63.9% |
| Mean | 44.2% | 50.5% |
| Median | 45.0% | 48.2% |
| Interquartile 25% (IQ1) | 36.8% | 43.8% |
| Interquartile 75% (IQ3) | 51.5% | 55.2% |
| Interquartile Range (IQR) | 14.7% | 11.4% |
| Standard Deviation (Sample) | 11.1% | 12.8% |
| Standard Deviation (Population) | 11.0% | 12.7% |
Similar Demographics by Married-couple Households
Demographics Similar to Guyanese by Married-couple Households
In terms of married-couple households, the demographic groups most similar to Guyanese are Immigrants from Western Africa (41.4%, a difference of 0.010%), Crow (41.4%, a difference of 0.010%), Immigrants from Trinidad and Tobago (41.2%, a difference of 0.36%), Sioux (41.5%, a difference of 0.37%), and Haitian (41.2%, a difference of 0.44%).
| Demographics | Rating | Rank | Married-couple Households |
| Immigrants | Ghana | 0.0 /100 | #299 | Tragic 41.8% |
| Immigrants | Belize | 0.0 /100 | #300 | Tragic 41.8% |
| Immigrants | Bahamas | 0.0 /100 | #301 | Tragic 41.7% |
| Immigrants | Honduras | 0.0 /100 | #302 | Tragic 41.6% |
| Sub-Saharan Africans | 0.0 /100 | #303 | Tragic 41.6% |
| Immigrants | Guyana | 0.0 /100 | #304 | Tragic 41.6% |
| Sioux | 0.0 /100 | #305 | Tragic 41.5% |
| Guyanese | 0.0 /100 | #306 | Tragic 41.4% |
| Immigrants | Western Africa | 0.0 /100 | #307 | Tragic 41.4% |
| Crow | 0.0 /100 | #308 | Tragic 41.4% |
| Immigrants | Trinidad and Tobago | 0.0 /100 | #309 | Tragic 41.2% |
| Haitians | 0.0 /100 | #310 | Tragic 41.2% |
| Colville | 0.0 /100 | #311 | Tragic 41.0% |
| Africans | 0.0 /100 | #312 | Tragic 40.9% |
| Immigrants | Haiti | 0.0 /100 | #313 | Tragic 40.9% |
Demographics Similar to Armenians by Married-couple Households
In terms of married-couple households, the demographic groups most similar to Armenians are Arab (46.9%, a difference of 0.030%), Immigrants from Oceania (46.9%, a difference of 0.030%), Hmong (47.0%, a difference of 0.040%), Immigrants from Western Asia (46.9%, a difference of 0.040%), and Serbian (47.0%, a difference of 0.050%).
| Demographics | Rating | Rank | Married-couple Households |
| Paraguayans | 78.7 /100 | #149 | Good 47.0% |
| Immigrants | Russia | 77.6 /100 | #150 | Good 47.0% |
| Immigrants | Bulgaria | 76.8 /100 | #151 | Good 47.0% |
| Serbians | 76.3 /100 | #152 | Good 47.0% |
| Hmong | 76.2 /100 | #153 | Good 47.0% |
| Immigrants | Western Asia | 76.1 /100 | #154 | Good 46.9% |
| Arabs | 76.0 /100 | #155 | Good 46.9% |
| Armenians | 75.4 /100 | #156 | Good 46.9% |
| Immigrants | Oceania | 74.8 /100 | #157 | Good 46.9% |
| Immigrants | Nonimmigrants | 73.3 /100 | #158 | Good 46.9% |
| Osage | 73.2 /100 | #159 | Good 46.9% |
| Iraqis | 71.7 /100 | #160 | Good 46.9% |
| Delaware | 71.2 /100 | #161 | Good 46.8% |
| Colombians | 71.0 /100 | #162 | Good 46.8% |
| Immigrants | Turkey | 70.2 /100 | #163 | Good 46.8% |