Guyanese vs German Married-couple Households
COMPARE
Guyanese
German
Married-couple Households
Married-couple Households Comparison
Guyanese
Germans
41.4%
MARRIED-COUPLE HOUSEHOLDS
0.0/ 100
METRIC RATING
306th/ 347
METRIC RANK
49.2%
MARRIED-COUPLE HOUSEHOLDS
99.8/ 100
METRIC RATING
28th/ 347
METRIC RANK
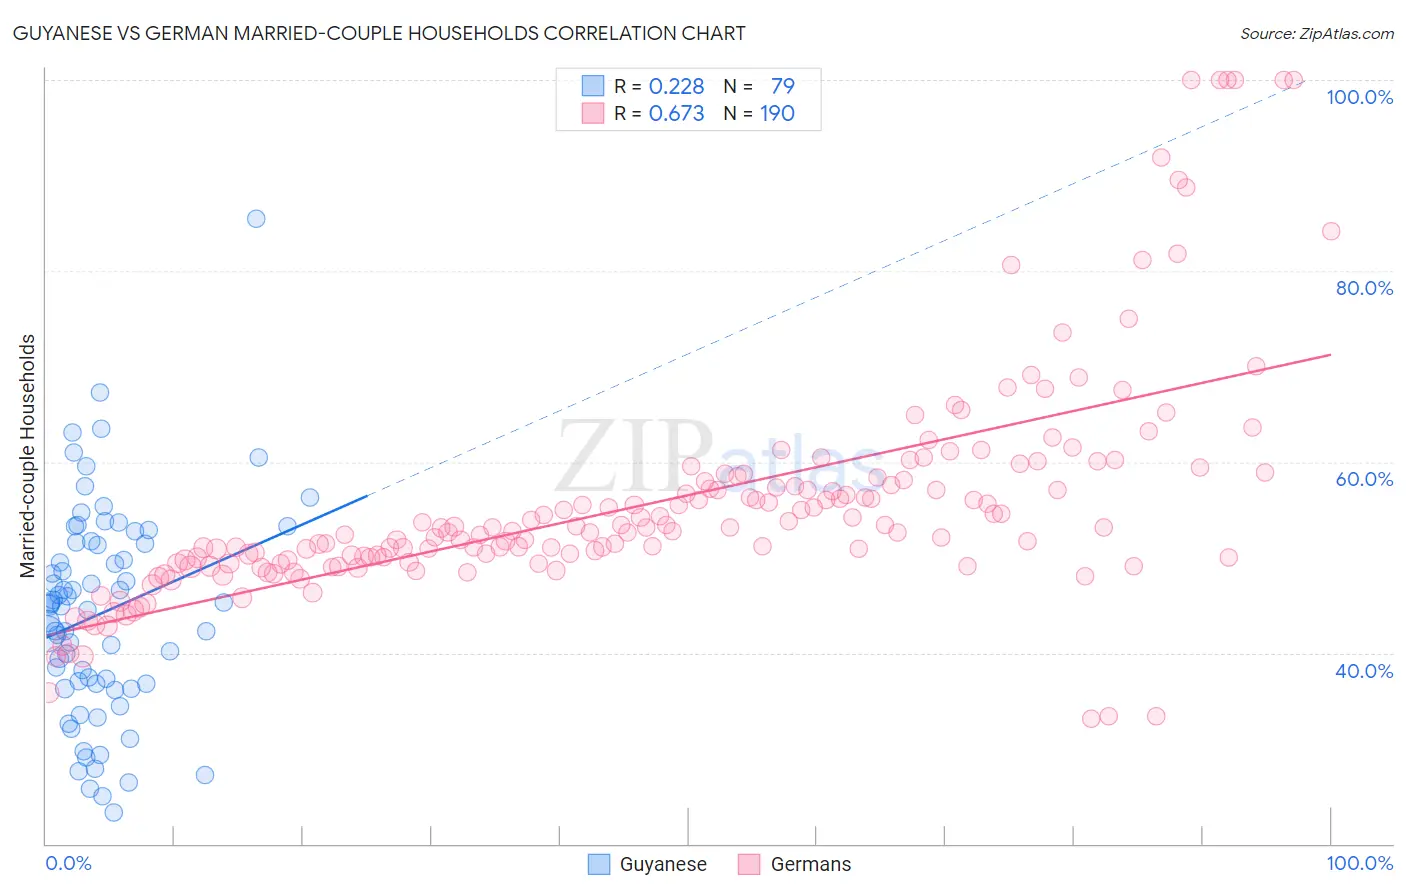
Guyanese vs German Married-couple Households Correlation Chart
The statistical analysis conducted on geographies consisting of 176,795,479 people shows a weak positive correlation between the proportion of Guyanese and percentage of married-couple family households in the United States with a correlation coefficient (R) of 0.228 and weighted average of 41.4%. Similarly, the statistical analysis conducted on geographies consisting of 580,558,752 people shows a significant positive correlation between the proportion of Germans and percentage of married-couple family households in the United States with a correlation coefficient (R) of 0.673 and weighted average of 49.2%, a difference of 18.9%.
Married-couple Households Correlation Summary
| Measurement | Guyanese | German |
| Minimum | 23.3% | 33.1% |
| Maximum | 85.4% | 100.0% |
| Range | 62.2% | 66.9% |
| Mean | 44.2% | 55.8% |
| Median | 45.0% | 53.1% |
| Interquartile 25% (IQ1) | 36.8% | 49.7% |
| Interquartile 75% (IQ3) | 51.5% | 58.1% |
| Interquartile Range (IQR) | 14.7% | 8.4% |
| Standard Deviation (Sample) | 11.1% | 12.1% |
| Standard Deviation (Population) | 11.0% | 12.1% |
Similar Demographics by Married-couple Households
Demographics Similar to Guyanese by Married-couple Households
In terms of married-couple households, the demographic groups most similar to Guyanese are Immigrants from Western Africa (41.4%, a difference of 0.010%), Crow (41.4%, a difference of 0.010%), Immigrants from Trinidad and Tobago (41.2%, a difference of 0.36%), Sioux (41.5%, a difference of 0.37%), and Haitian (41.2%, a difference of 0.44%).
| Demographics | Rating | Rank | Married-couple Households |
| Immigrants | Ghana | 0.0 /100 | #299 | Tragic 41.8% |
| Immigrants | Belize | 0.0 /100 | #300 | Tragic 41.8% |
| Immigrants | Bahamas | 0.0 /100 | #301 | Tragic 41.7% |
| Immigrants | Honduras | 0.0 /100 | #302 | Tragic 41.6% |
| Sub-Saharan Africans | 0.0 /100 | #303 | Tragic 41.6% |
| Immigrants | Guyana | 0.0 /100 | #304 | Tragic 41.6% |
| Sioux | 0.0 /100 | #305 | Tragic 41.5% |
| Guyanese | 0.0 /100 | #306 | Tragic 41.4% |
| Immigrants | Western Africa | 0.0 /100 | #307 | Tragic 41.4% |
| Crow | 0.0 /100 | #308 | Tragic 41.4% |
| Immigrants | Trinidad and Tobago | 0.0 /100 | #309 | Tragic 41.2% |
| Haitians | 0.0 /100 | #310 | Tragic 41.2% |
| Colville | 0.0 /100 | #311 | Tragic 41.0% |
| Africans | 0.0 /100 | #312 | Tragic 40.9% |
| Immigrants | Haiti | 0.0 /100 | #313 | Tragic 40.9% |
Demographics Similar to Germans by Married-couple Households
In terms of married-couple households, the demographic groups most similar to Germans are Maltese (49.2%, a difference of 0.010%), Bolivian (49.2%, a difference of 0.020%), Native Hawaiian (49.1%, a difference of 0.13%), Bhutanese (49.3%, a difference of 0.19%), and Hungarian (49.1%, a difference of 0.19%).
| Demographics | Rating | Rank | Married-couple Households |
| Norwegians | 99.9 /100 | #21 | Exceptional 49.5% |
| Asians | 99.9 /100 | #22 | Exceptional 49.5% |
| Dutch | 99.9 /100 | #23 | Exceptional 49.5% |
| Czechs | 99.9 /100 | #24 | Exceptional 49.4% |
| Immigrants | Philippines | 99.9 /100 | #25 | Exceptional 49.3% |
| Immigrants | Scotland | 99.8 /100 | #26 | Exceptional 49.3% |
| Bhutanese | 99.8 /100 | #27 | Exceptional 49.3% |
| Germans | 99.8 /100 | #28 | Exceptional 49.2% |
| Maltese | 99.8 /100 | #29 | Exceptional 49.2% |
| Bolivians | 99.8 /100 | #30 | Exceptional 49.2% |
| Native Hawaiians | 99.8 /100 | #31 | Exceptional 49.1% |
| Hungarians | 99.8 /100 | #32 | Exceptional 49.1% |
| Immigrants | Asia | 99.7 /100 | #33 | Exceptional 49.1% |
| Italians | 99.7 /100 | #34 | Exceptional 49.0% |
| Scottish | 99.7 /100 | #35 | Exceptional 49.0% |