Immigrants from Eastern Asia vs German Married-couple Households
COMPARE
Immigrants from Eastern Asia
German
Married-couple Households
Married-couple Households Comparison
Immigrants from Eastern Asia
Germans
48.8%
MARRIED-COUPLE HOUSEHOLDS
99.5/ 100
METRIC RATING
45th/ 347
METRIC RANK
49.2%
MARRIED-COUPLE HOUSEHOLDS
99.8/ 100
METRIC RATING
28th/ 347
METRIC RANK
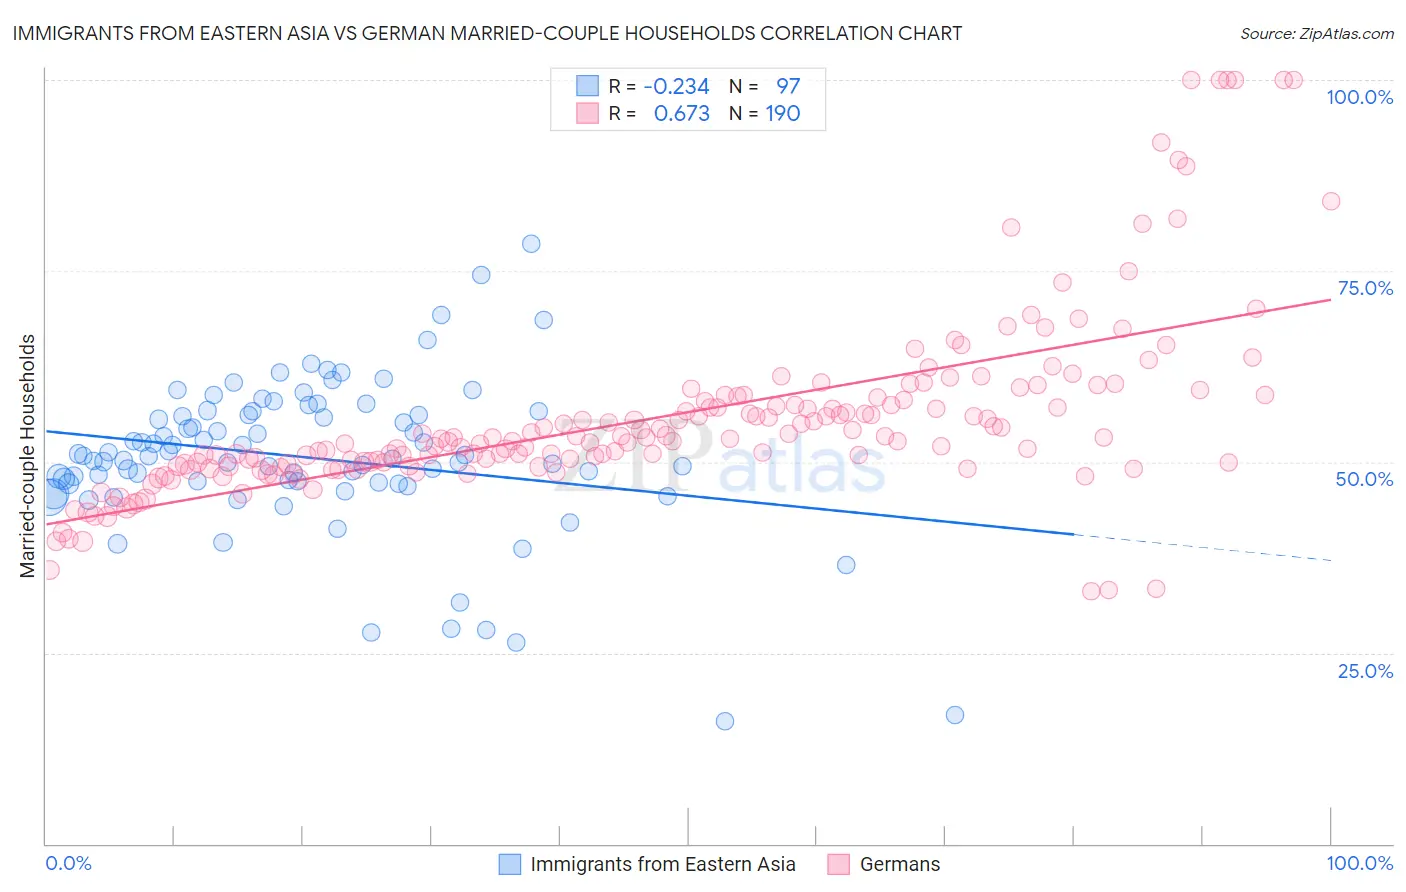
Immigrants from Eastern Asia vs German Married-couple Households Correlation Chart
The statistical analysis conducted on geographies consisting of 499,367,501 people shows a weak negative correlation between the proportion of Immigrants from Eastern Asia and percentage of married-couple family households in the United States with a correlation coefficient (R) of -0.234 and weighted average of 48.8%. Similarly, the statistical analysis conducted on geographies consisting of 580,558,752 people shows a significant positive correlation between the proportion of Germans and percentage of married-couple family households in the United States with a correlation coefficient (R) of 0.673 and weighted average of 49.2%, a difference of 0.82%.
Married-couple Households Correlation Summary
| Measurement | Immigrants from Eastern Asia | German |
| Minimum | 16.0% | 33.1% |
| Maximum | 78.6% | 100.0% |
| Range | 62.6% | 66.9% |
| Mean | 50.6% | 55.8% |
| Median | 50.7% | 53.1% |
| Interquartile 25% (IQ1) | 47.2% | 49.7% |
| Interquartile 75% (IQ3) | 56.4% | 58.1% |
| Interquartile Range (IQR) | 9.2% | 8.4% |
| Standard Deviation (Sample) | 10.2% | 12.1% |
| Standard Deviation (Population) | 10.1% | 12.1% |
Demographics Similar to Immigrants from Eastern Asia and Germans by Married-couple Households
In terms of married-couple households, the demographic groups most similar to Immigrants from Eastern Asia are Welsh (48.8%, a difference of 0.030%), Tsimshian (48.7%, a difference of 0.050%), Immigrants from Iran (48.8%, a difference of 0.080%), Immigrants from Vietnam (48.8%, a difference of 0.13%), and Immigrants from Lebanon (48.9%, a difference of 0.18%). Similarly, the demographic groups most similar to Germans are Maltese (49.2%, a difference of 0.010%), Bolivian (49.2%, a difference of 0.020%), Native Hawaiian (49.1%, a difference of 0.13%), Bhutanese (49.3%, a difference of 0.19%), and Hungarian (49.1%, a difference of 0.19%).
| Demographics | Rating | Rank | Married-couple Households |
| Immigrants | Scotland | 99.8 /100 | #26 | Exceptional 49.3% |
| Bhutanese | 99.8 /100 | #27 | Exceptional 49.3% |
| Germans | 99.8 /100 | #28 | Exceptional 49.2% |
| Maltese | 99.8 /100 | #29 | Exceptional 49.2% |
| Bolivians | 99.8 /100 | #30 | Exceptional 49.2% |
| Native Hawaiians | 99.8 /100 | #31 | Exceptional 49.1% |
| Hungarians | 99.8 /100 | #32 | Exceptional 49.1% |
| Immigrants | Asia | 99.7 /100 | #33 | Exceptional 49.1% |
| Italians | 99.7 /100 | #34 | Exceptional 49.0% |
| Scottish | 99.7 /100 | #35 | Exceptional 49.0% |
| Iranians | 99.7 /100 | #36 | Exceptional 49.0% |
| Sri Lankans | 99.7 /100 | #37 | Exceptional 49.0% |
| Greeks | 99.7 /100 | #38 | Exceptional 48.9% |
| Lithuanians | 99.6 /100 | #39 | Exceptional 48.9% |
| Immigrants | Bolivia | 99.6 /100 | #40 | Exceptional 48.9% |
| Immigrants | Lebanon | 99.6 /100 | #41 | Exceptional 48.9% |
| Immigrants | Vietnam | 99.6 /100 | #42 | Exceptional 48.8% |
| Immigrants | Iran | 99.6 /100 | #43 | Exceptional 48.8% |
| Welsh | 99.5 /100 | #44 | Exceptional 48.8% |
| Immigrants | Eastern Asia | 99.5 /100 | #45 | Exceptional 48.8% |
| Tsimshian | 99.5 /100 | #46 | Exceptional 48.7% |