Immigrants from Australia vs Pakistani Family Households with Children
COMPARE
Immigrants from Australia
Pakistani
Family Households with Children
Family Households with Children Comparison
Immigrants from Australia
Pakistanis
26.0%
FAMILY HOUSEHOLDS WITH CHILDREN
0.0/ 100
METRIC RATING
323rd/ 347
METRIC RANK
27.9%
FAMILY HOUSEHOLDS WITH CHILDREN
96.0/ 100
METRIC RATING
116th/ 347
METRIC RANK
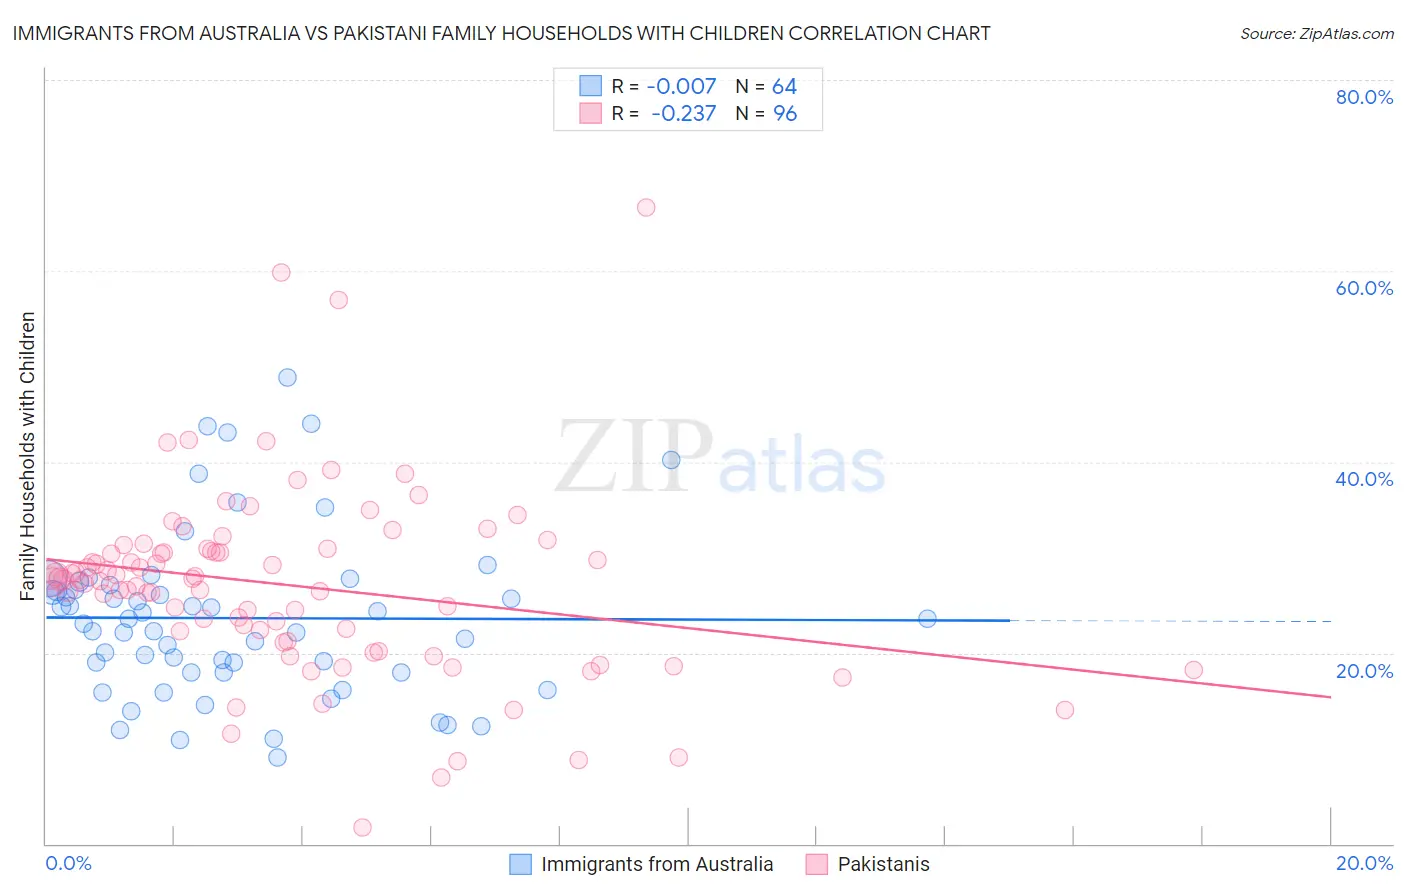
Immigrants from Australia vs Pakistani Family Households with Children Correlation Chart
The statistical analysis conducted on geographies consisting of 227,064,474 people shows no correlation between the proportion of Immigrants from Australia and percentage of family households with children in the United States with a correlation coefficient (R) of -0.007 and weighted average of 26.0%. Similarly, the statistical analysis conducted on geographies consisting of 335,080,458 people shows a weak negative correlation between the proportion of Pakistanis and percentage of family households with children in the United States with a correlation coefficient (R) of -0.237 and weighted average of 27.9%, a difference of 7.3%.
Family Households with Children Correlation Summary
| Measurement | Immigrants from Australia | Pakistani |
| Minimum | 9.0% | 1.7% |
| Maximum | 48.8% | 66.6% |
| Range | 39.8% | 64.9% |
| Mean | 23.6% | 27.1% |
| Median | 23.3% | 27.7% |
| Interquartile 25% (IQ1) | 18.0% | 21.8% |
| Interquartile 75% (IQ3) | 26.9% | 30.7% |
| Interquartile Range (IQR) | 8.9% | 9.0% |
| Standard Deviation (Sample) | 8.6% | 9.9% |
| Standard Deviation (Population) | 8.5% | 9.9% |
Similar Demographics by Family Households with Children
Demographics Similar to Immigrants from Australia by Family Households with Children
In terms of family households with children, the demographic groups most similar to Immigrants from Australia are Immigrants from Greece (26.0%, a difference of 0.030%), Chinese (26.0%, a difference of 0.030%), British West Indian (26.0%, a difference of 0.040%), Tlingit-Haida (26.0%, a difference of 0.060%), and Immigrants from France (26.0%, a difference of 0.070%).
| Demographics | Rating | Rank | Family Households with Children |
| Estonians | 0.0 /100 | #316 | Tragic 26.1% |
| Ottawa | 0.0 /100 | #317 | Tragic 26.1% |
| Iroquois | 0.0 /100 | #318 | Tragic 26.1% |
| Immigrants | France | 0.0 /100 | #319 | Tragic 26.0% |
| Tlingit-Haida | 0.0 /100 | #320 | Tragic 26.0% |
| British West Indians | 0.0 /100 | #321 | Tragic 26.0% |
| Immigrants | Greece | 0.0 /100 | #322 | Tragic 26.0% |
| Immigrants | Australia | 0.0 /100 | #323 | Tragic 26.0% |
| Chinese | 0.0 /100 | #324 | Tragic 26.0% |
| Barbadians | 0.0 /100 | #325 | Tragic 26.0% |
| Immigrants | Ireland | 0.0 /100 | #326 | Tragic 26.0% |
| Immigrants | Barbados | 0.0 /100 | #327 | Tragic 26.0% |
| Immigrants | Albania | 0.0 /100 | #328 | Tragic 25.9% |
| Cypriots | 0.0 /100 | #329 | Tragic 25.9% |
| Immigrants | Latvia | 0.0 /100 | #330 | Tragic 25.9% |
Demographics Similar to Pakistanis by Family Households with Children
In terms of family households with children, the demographic groups most similar to Pakistanis are Immigrants from Malaysia (27.9%, a difference of 0.010%), Central American Indian (27.9%, a difference of 0.010%), Zimbabwean (27.9%, a difference of 0.050%), European (27.9%, a difference of 0.080%), and Immigrants from Africa (28.0%, a difference of 0.13%).
| Demographics | Rating | Rank | Family Households with Children |
| Tohono O'odham | 97.6 /100 | #109 | Exceptional 28.0% |
| Spaniards | 97.4 /100 | #110 | Exceptional 28.0% |
| Scandinavians | 97.1 /100 | #111 | Exceptional 28.0% |
| Immigrants | Middle Africa | 97.0 /100 | #112 | Exceptional 28.0% |
| Arabs | 97.0 /100 | #113 | Exceptional 28.0% |
| South American Indians | 96.9 /100 | #114 | Exceptional 28.0% |
| Immigrants | Africa | 96.8 /100 | #115 | Exceptional 28.0% |
| Pakistanis | 96.0 /100 | #116 | Exceptional 27.9% |
| Immigrants | Malaysia | 95.9 /100 | #117 | Exceptional 27.9% |
| Central American Indians | 95.9 /100 | #118 | Exceptional 27.9% |
| Zimbabweans | 95.6 /100 | #119 | Exceptional 27.9% |
| Europeans | 95.4 /100 | #120 | Exceptional 27.9% |
| Immigrants | Western Asia | 93.6 /100 | #121 | Exceptional 27.9% |
| Immigrants | Zimbabwe | 92.8 /100 | #122 | Exceptional 27.8% |
| Immigrants | Northern Africa | 91.8 /100 | #123 | Exceptional 27.8% |