Jordanian vs Pakistani Family Households with Children
COMPARE
Jordanian
Pakistani
Family Households with Children
Family Households with Children Comparison
Jordanians
Pakistanis
29.0%
FAMILY HOUSEHOLDS WITH CHILDREN
100.0/ 100
METRIC RATING
49th/ 347
METRIC RANK
27.9%
FAMILY HOUSEHOLDS WITH CHILDREN
96.0/ 100
METRIC RATING
116th/ 347
METRIC RANK
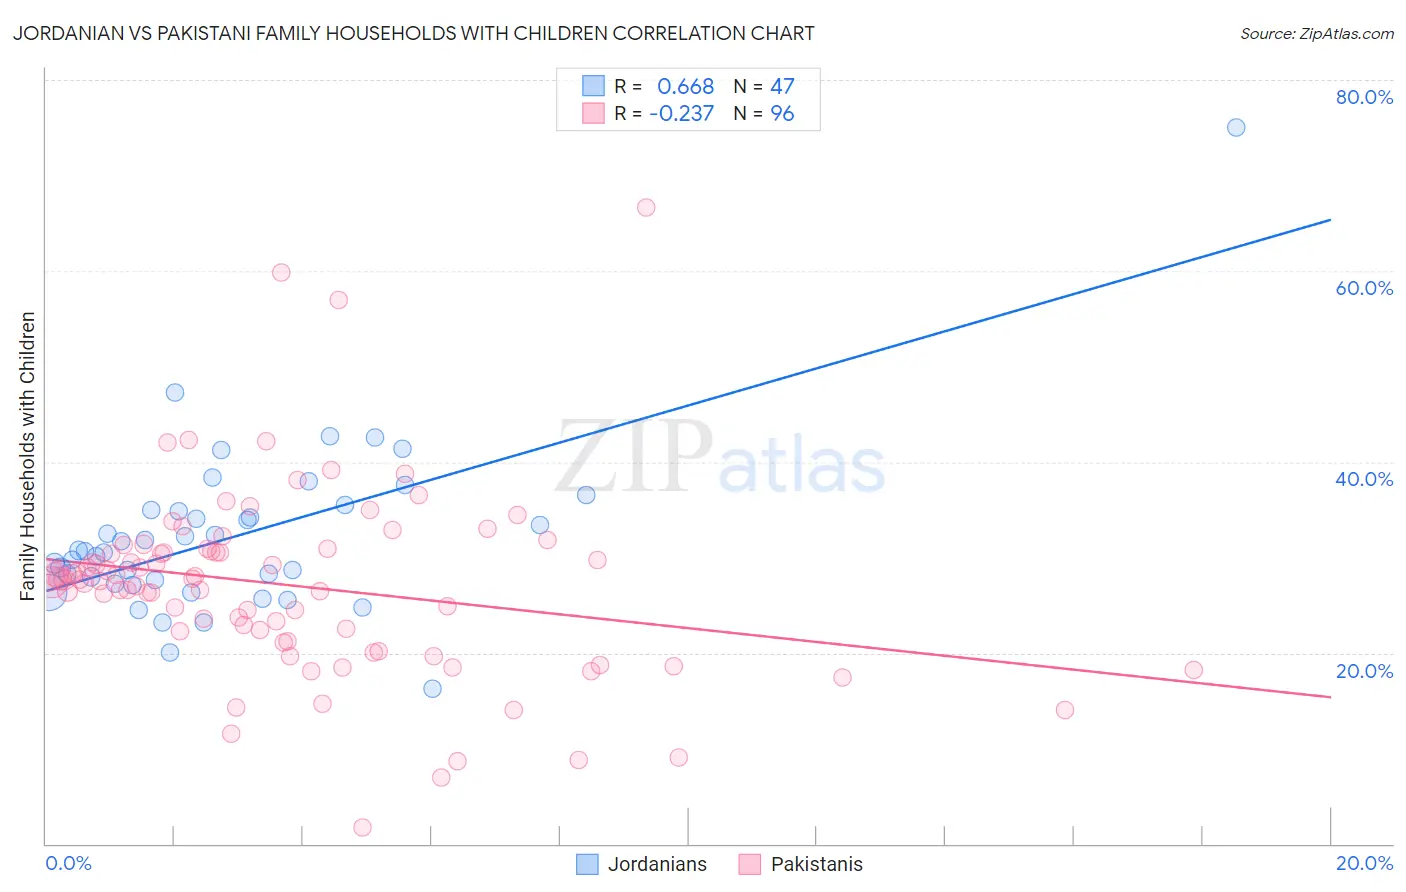
Jordanian vs Pakistani Family Households with Children Correlation Chart
The statistical analysis conducted on geographies consisting of 166,374,879 people shows a significant positive correlation between the proportion of Jordanians and percentage of family households with children in the United States with a correlation coefficient (R) of 0.668 and weighted average of 29.0%. Similarly, the statistical analysis conducted on geographies consisting of 335,080,458 people shows a weak negative correlation between the proportion of Pakistanis and percentage of family households with children in the United States with a correlation coefficient (R) of -0.237 and weighted average of 27.9%, a difference of 3.7%.
Family Households with Children Correlation Summary
| Measurement | Jordanian | Pakistani |
| Minimum | 16.3% | 1.7% |
| Maximum | 75.0% | 66.6% |
| Range | 58.7% | 64.9% |
| Mean | 32.2% | 27.1% |
| Median | 30.6% | 27.7% |
| Interquartile 25% (IQ1) | 27.3% | 21.8% |
| Interquartile 75% (IQ3) | 34.9% | 30.7% |
| Interquartile Range (IQR) | 7.6% | 9.0% |
| Standard Deviation (Sample) | 8.9% | 9.9% |
| Standard Deviation (Population) | 8.8% | 9.9% |
Similar Demographics by Family Households with Children
Demographics Similar to Jordanians by Family Households with Children
In terms of family households with children, the demographic groups most similar to Jordanians are Apache (29.0%, a difference of 0.090%), Immigrants (28.9%, a difference of 0.11%), Peruvian (29.0%, a difference of 0.12%), Immigrants from Philippines (29.0%, a difference of 0.13%), and Immigrants from Peru (28.9%, a difference of 0.14%).
| Demographics | Rating | Rank | Family Households with Children |
| Spanish American Indians | 100.0 /100 | #42 | Exceptional 29.1% |
| Asians | 100.0 /100 | #43 | Exceptional 29.1% |
| Immigrants | Taiwan | 100.0 /100 | #44 | Exceptional 29.0% |
| Fijians | 100.0 /100 | #45 | Exceptional 29.0% |
| Immigrants | Philippines | 100.0 /100 | #46 | Exceptional 29.0% |
| Peruvians | 100.0 /100 | #47 | Exceptional 29.0% |
| Apache | 100.0 /100 | #48 | Exceptional 29.0% |
| Jordanians | 100.0 /100 | #49 | Exceptional 29.0% |
| Immigrants | Immigrants | 100.0 /100 | #50 | Exceptional 28.9% |
| Immigrants | Peru | 100.0 /100 | #51 | Exceptional 28.9% |
| Guatemalans | 100.0 /100 | #52 | Exceptional 28.9% |
| Immigrants | Cambodia | 100.0 /100 | #53 | Exceptional 28.9% |
| Sierra Leoneans | 100.0 /100 | #54 | Exceptional 28.9% |
| Immigrants | Asia | 100.0 /100 | #55 | Exceptional 28.8% |
| Immigrants | Guatemala | 100.0 /100 | #56 | Exceptional 28.8% |
Demographics Similar to Pakistanis by Family Households with Children
In terms of family households with children, the demographic groups most similar to Pakistanis are Immigrants from Malaysia (27.9%, a difference of 0.010%), Central American Indian (27.9%, a difference of 0.010%), Zimbabwean (27.9%, a difference of 0.050%), European (27.9%, a difference of 0.080%), and Immigrants from Africa (28.0%, a difference of 0.13%).
| Demographics | Rating | Rank | Family Households with Children |
| Tohono O'odham | 97.6 /100 | #109 | Exceptional 28.0% |
| Spaniards | 97.4 /100 | #110 | Exceptional 28.0% |
| Scandinavians | 97.1 /100 | #111 | Exceptional 28.0% |
| Immigrants | Middle Africa | 97.0 /100 | #112 | Exceptional 28.0% |
| Arabs | 97.0 /100 | #113 | Exceptional 28.0% |
| South American Indians | 96.9 /100 | #114 | Exceptional 28.0% |
| Immigrants | Africa | 96.8 /100 | #115 | Exceptional 28.0% |
| Pakistanis | 96.0 /100 | #116 | Exceptional 27.9% |
| Immigrants | Malaysia | 95.9 /100 | #117 | Exceptional 27.9% |
| Central American Indians | 95.9 /100 | #118 | Exceptional 27.9% |
| Zimbabweans | 95.6 /100 | #119 | Exceptional 27.9% |
| Europeans | 95.4 /100 | #120 | Exceptional 27.9% |
| Immigrants | Western Asia | 93.6 /100 | #121 | Exceptional 27.9% |
| Immigrants | Zimbabwe | 92.8 /100 | #122 | Exceptional 27.8% |
| Immigrants | Northern Africa | 91.8 /100 | #123 | Exceptional 27.8% |