Iraqi vs Immigrants from Liberia Family Households with Children
COMPARE
Iraqi
Immigrants from Liberia
Family Households with Children
Family Households with Children Comparison
Iraqis
Immigrants from Liberia
28.5%
FAMILY HOUSEHOLDS WITH CHILDREN
99.9/ 100
METRIC RATING
73rd/ 347
METRIC RANK
28.2%
FAMILY HOUSEHOLDS WITH CHILDREN
99.4/ 100
METRIC RATING
91st/ 347
METRIC RANK
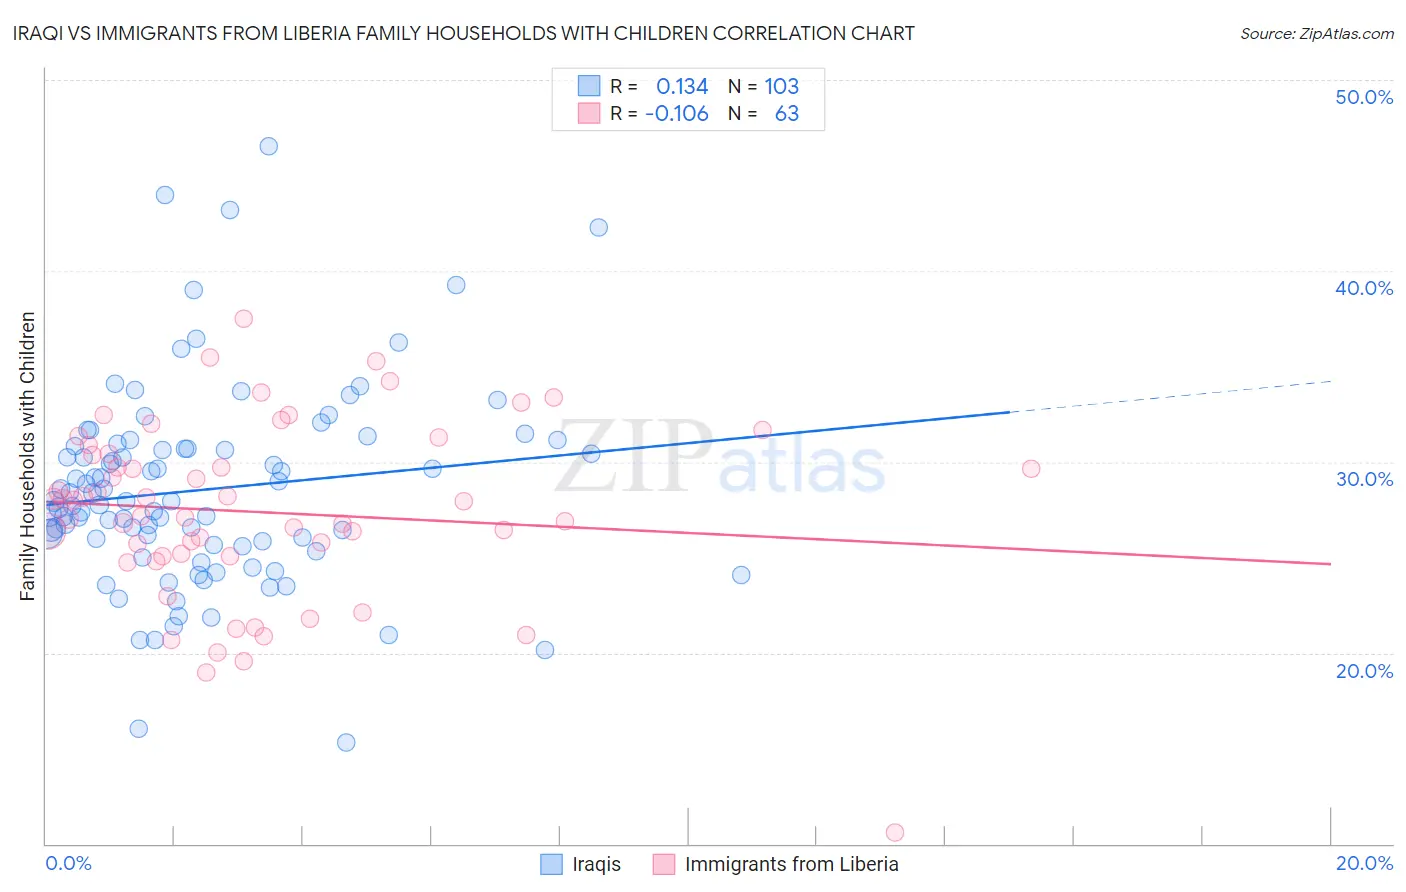
Iraqi vs Immigrants from Liberia Family Households with Children Correlation Chart
The statistical analysis conducted on geographies consisting of 170,533,912 people shows a poor positive correlation between the proportion of Iraqis and percentage of family households with children in the United States with a correlation coefficient (R) of 0.134 and weighted average of 28.5%. Similarly, the statistical analysis conducted on geographies consisting of 135,222,977 people shows a poor negative correlation between the proportion of Immigrants from Liberia and percentage of family households with children in the United States with a correlation coefficient (R) of -0.106 and weighted average of 28.2%, a difference of 0.91%.
Family Households with Children Correlation Summary
| Measurement | Iraqi | Immigrants from Liberia |
| Minimum | 15.3% | 10.6% |
| Maximum | 46.5% | 37.5% |
| Range | 31.3% | 26.9% |
| Mean | 28.5% | 27.4% |
| Median | 27.9% | 28.0% |
| Interquartile 25% (IQ1) | 25.6% | 25.1% |
| Interquartile 75% (IQ3) | 30.8% | 30.4% |
| Interquartile Range (IQR) | 5.2% | 5.4% |
| Standard Deviation (Sample) | 5.2% | 4.7% |
| Standard Deviation (Population) | 5.2% | 4.7% |
Demographics Similar to Iraqis and Immigrants from Liberia by Family Households with Children
In terms of family households with children, the demographic groups most similar to Iraqis are Laotian (28.5%, a difference of 0.010%), Immigrants from Indonesia (28.5%, a difference of 0.030%), Immigrants from Jordan (28.4%, a difference of 0.14%), Immigrants from Sri Lanka (28.4%, a difference of 0.15%), and Nigerian (28.4%, a difference of 0.20%). Similarly, the demographic groups most similar to Immigrants from Liberia are Chickasaw (28.2%, a difference of 0.020%), Immigrants from Thailand (28.2%, a difference of 0.050%), Liberian (28.3%, a difference of 0.16%), Immigrants from Costa Rica (28.3%, a difference of 0.16%), and Colombian (28.3%, a difference of 0.18%).
| Demographics | Rating | Rank | Family Households with Children |
| Immigrants | Indonesia | 99.9 /100 | #72 | Exceptional 28.5% |
| Iraqis | 99.9 /100 | #73 | Exceptional 28.5% |
| Laotians | 99.9 /100 | #74 | Exceptional 28.5% |
| Immigrants | Jordan | 99.9 /100 | #75 | Exceptional 28.4% |
| Immigrants | Sri Lanka | 99.9 /100 | #76 | Exceptional 28.4% |
| Nigerians | 99.8 /100 | #77 | Exceptional 28.4% |
| Immigrants | Nepal | 99.8 /100 | #78 | Exceptional 28.4% |
| Immigrants | Iraq | 99.8 /100 | #79 | Exceptional 28.4% |
| Natives/Alaskans | 99.8 /100 | #80 | Exceptional 28.4% |
| South Americans | 99.8 /100 | #81 | Exceptional 28.4% |
| Kenyans | 99.8 /100 | #82 | Exceptional 28.4% |
| Nicaraguans | 99.8 /100 | #83 | Exceptional 28.4% |
| Costa Ricans | 99.8 /100 | #84 | Exceptional 28.4% |
| Immigrants | Syria | 99.8 /100 | #85 | Exceptional 28.4% |
| Immigrants | Western Africa | 99.6 /100 | #86 | Exceptional 28.3% |
| Colombians | 99.6 /100 | #87 | Exceptional 28.3% |
| Liberians | 99.6 /100 | #88 | Exceptional 28.3% |
| Immigrants | Costa Rica | 99.6 /100 | #89 | Exceptional 28.3% |
| Immigrants | Thailand | 99.5 /100 | #90 | Exceptional 28.2% |
| Immigrants | Liberia | 99.4 /100 | #91 | Exceptional 28.2% |
| Chickasaw | 99.4 /100 | #92 | Exceptional 28.2% |