Tohono O'odham vs Immigrants from Liberia Family Households with Children
COMPARE
Tohono O'odham
Immigrants from Liberia
Family Households with Children
Family Households with Children Comparison
Tohono O'odham
Immigrants from Liberia
28.0%
FAMILY HOUSEHOLDS WITH CHILDREN
97.6/ 100
METRIC RATING
109th/ 347
METRIC RANK
28.2%
FAMILY HOUSEHOLDS WITH CHILDREN
99.4/ 100
METRIC RATING
91st/ 347
METRIC RANK
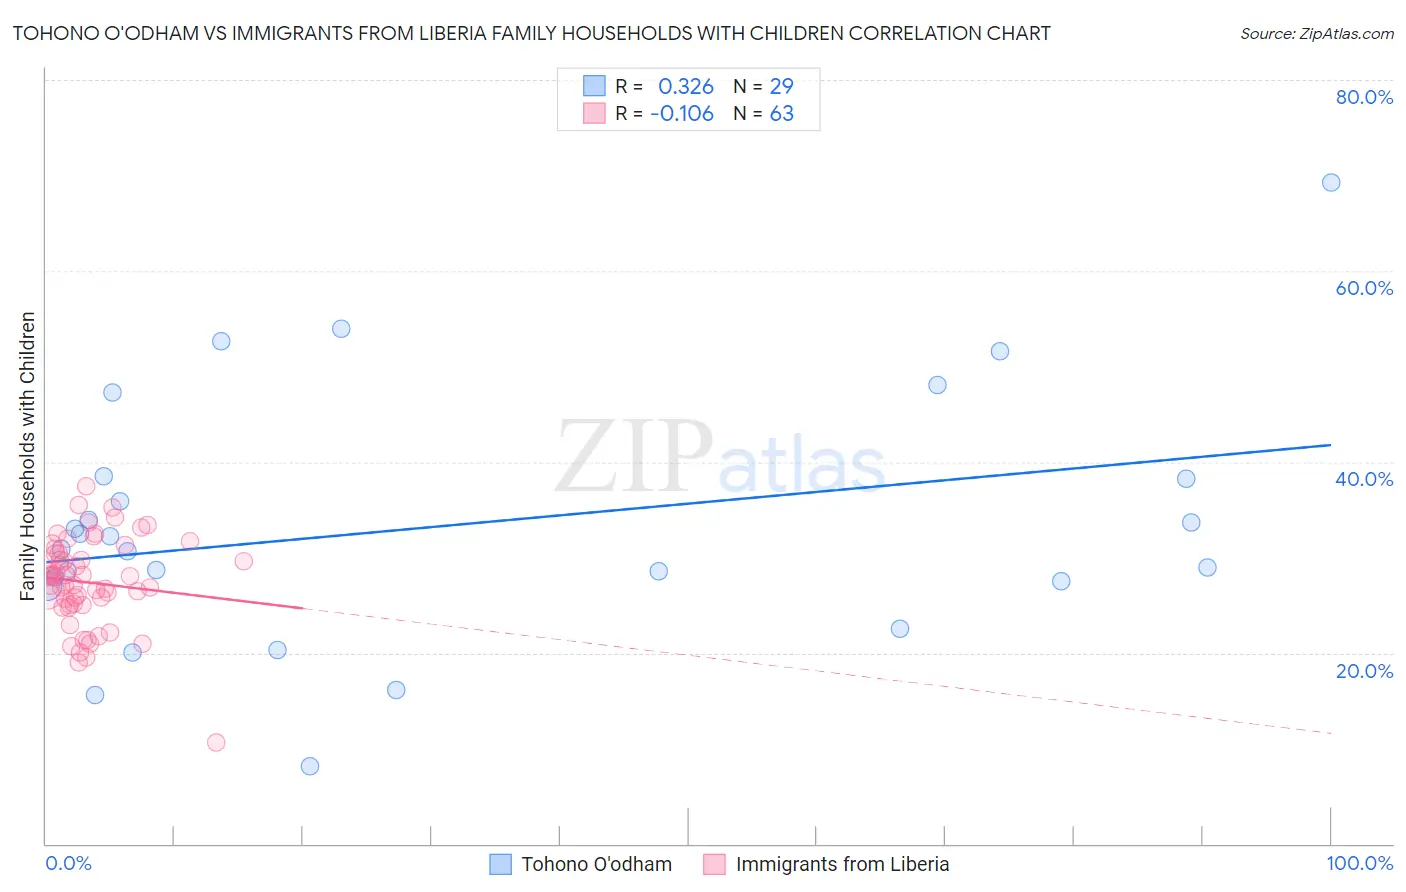
Tohono O'odham vs Immigrants from Liberia Family Households with Children Correlation Chart
The statistical analysis conducted on geographies consisting of 58,703,775 people shows a mild positive correlation between the proportion of Tohono O'odham and percentage of family households with children in the United States with a correlation coefficient (R) of 0.326 and weighted average of 28.0%. Similarly, the statistical analysis conducted on geographies consisting of 135,222,977 people shows a poor negative correlation between the proportion of Immigrants from Liberia and percentage of family households with children in the United States with a correlation coefficient (R) of -0.106 and weighted average of 28.2%, a difference of 0.78%.
Family Households with Children Correlation Summary
| Measurement | Tohono O'odham | Immigrants from Liberia |
| Minimum | 8.1% | 10.6% |
| Maximum | 69.3% | 37.5% |
| Range | 61.2% | 26.9% |
| Mean | 33.2% | 27.4% |
| Median | 30.8% | 28.0% |
| Interquartile 25% (IQ1) | 27.2% | 25.1% |
| Interquartile 75% (IQ3) | 38.3% | 30.4% |
| Interquartile Range (IQR) | 11.1% | 5.4% |
| Standard Deviation (Sample) | 13.1% | 4.7% |
| Standard Deviation (Population) | 12.9% | 4.7% |
Demographics Similar to Tohono O'odham and Immigrants from Liberia by Family Households with Children
In terms of family households with children, the demographic groups most similar to Tohono O'odham are Immigrants from Burma/Myanmar (28.0%, a difference of 0.010%), Immigrants from Uganda (28.0%, a difference of 0.020%), Spaniard (28.0%, a difference of 0.040%), Immigrants from South America (28.0%, a difference of 0.090%), and Choctaw (28.1%, a difference of 0.19%). Similarly, the demographic groups most similar to Immigrants from Liberia are Chickasaw (28.2%, a difference of 0.020%), Immigrants from Thailand (28.2%, a difference of 0.050%), Panamanian (28.2%, a difference of 0.13%), Immigrants from Colombia (28.2%, a difference of 0.18%), and Immigrants from Nicaragua (28.2%, a difference of 0.24%).
| Demographics | Rating | Rank | Family Households with Children |
| Immigrants | Thailand | 99.5 /100 | #90 | Exceptional 28.2% |
| Immigrants | Liberia | 99.4 /100 | #91 | Exceptional 28.2% |
| Chickasaw | 99.4 /100 | #92 | Exceptional 28.2% |
| Panamanians | 99.3 /100 | #93 | Exceptional 28.2% |
| Immigrants | Colombia | 99.2 /100 | #94 | Exceptional 28.2% |
| Immigrants | Nicaragua | 99.1 /100 | #95 | Exceptional 28.2% |
| Ute | 99.1 /100 | #96 | Exceptional 28.2% |
| Chileans | 98.9 /100 | #97 | Exceptional 28.1% |
| Immigrants | Kenya | 98.9 /100 | #98 | Exceptional 28.1% |
| Immigrants | Azores | 98.8 /100 | #99 | Exceptional 28.1% |
| Indonesians | 98.8 /100 | #100 | Exceptional 28.1% |
| Immigrants | Oceania | 98.8 /100 | #101 | Exceptional 28.1% |
| Assyrians/Chaldeans/Syriacs | 98.7 /100 | #102 | Exceptional 28.1% |
| Palestinians | 98.5 /100 | #103 | Exceptional 28.1% |
| Sioux | 98.3 /100 | #104 | Exceptional 28.1% |
| Choctaw | 98.3 /100 | #105 | Exceptional 28.1% |
| Immigrants | South America | 98.0 /100 | #106 | Exceptional 28.0% |
| Immigrants | Uganda | 97.7 /100 | #107 | Exceptional 28.0% |
| Immigrants | Burma/Myanmar | 97.7 /100 | #108 | Exceptional 28.0% |
| Tohono O'odham | 97.6 /100 | #109 | Exceptional 28.0% |
| Spaniards | 97.4 /100 | #110 | Exceptional 28.0% |