Guamanian/Chamorro vs Immigrants from Liberia Male Poverty
COMPARE
Guamanian/Chamorro
Immigrants from Liberia
Male Poverty
Male Poverty Comparison
Guamanians/Chamorros
Immigrants from Liberia
11.0%
MALE POVERTY
67.6/ 100
METRIC RATING
150th/ 347
METRIC RANK
13.0%
MALE POVERTY
0.1/ 100
METRIC RATING
255th/ 347
METRIC RANK
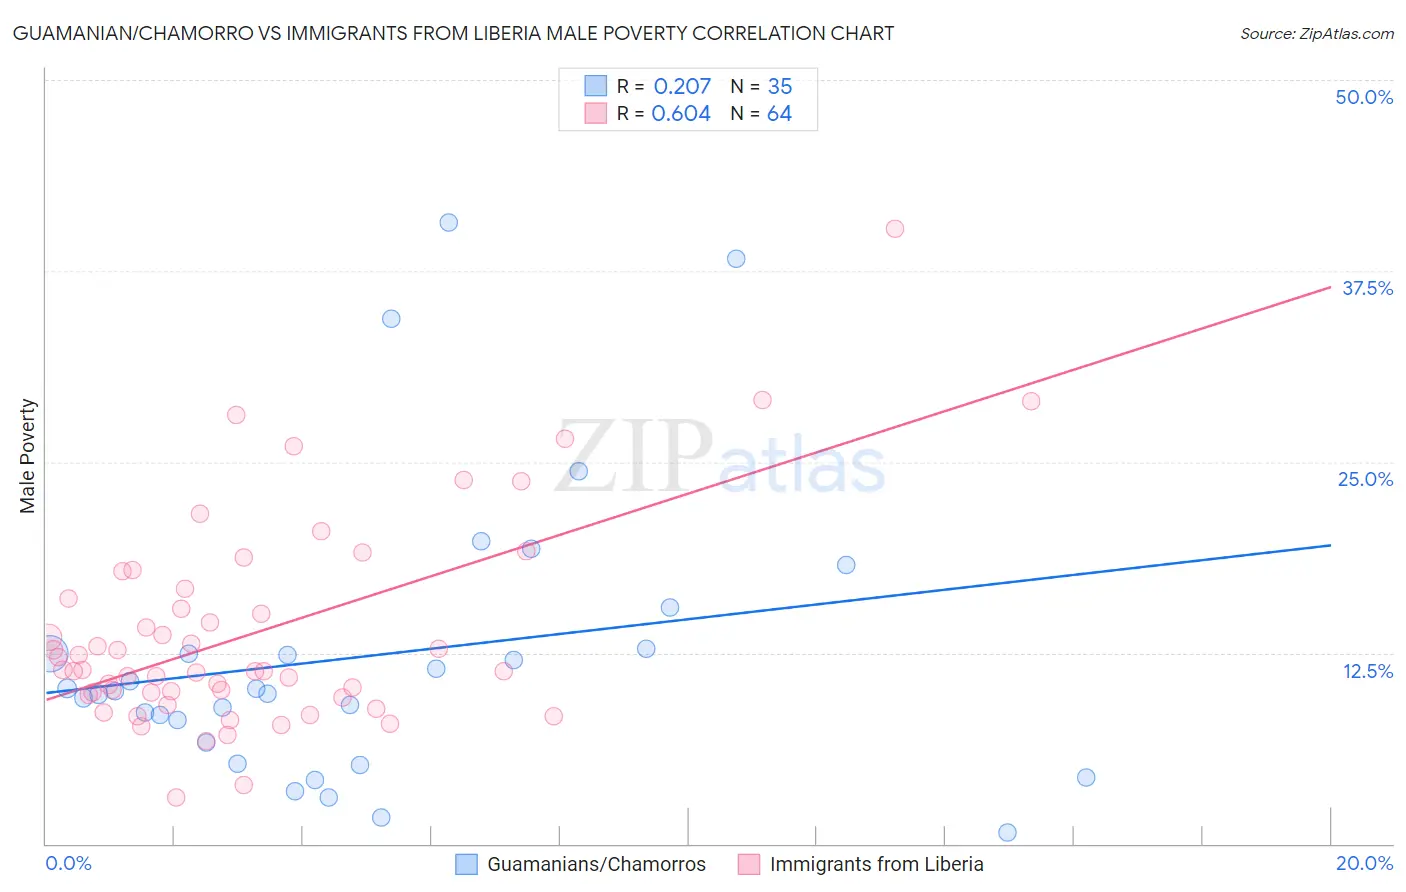
Guamanian/Chamorro vs Immigrants from Liberia Male Poverty Correlation Chart
The statistical analysis conducted on geographies consisting of 221,842,342 people shows a weak positive correlation between the proportion of Guamanians/Chamorros and poverty level among males in the United States with a correlation coefficient (R) of 0.207 and weighted average of 11.0%. Similarly, the statistical analysis conducted on geographies consisting of 135,246,514 people shows a significant positive correlation between the proportion of Immigrants from Liberia and poverty level among males in the United States with a correlation coefficient (R) of 0.604 and weighted average of 13.0%, a difference of 18.2%.
Male Poverty Correlation Summary
| Measurement | Guamanian/Chamorro | Immigrants from Liberia |
| Minimum | 0.76% | 3.0% |
| Maximum | 40.6% | 40.3% |
| Range | 39.9% | 37.2% |
| Mean | 12.3% | 13.8% |
| Median | 10.0% | 11.4% |
| Interquartile 25% (IQ1) | 6.6% | 9.8% |
| Interquartile 75% (IQ3) | 12.7% | 16.4% |
| Interquartile Range (IQR) | 6.1% | 6.6% |
| Standard Deviation (Sample) | 9.5% | 6.8% |
| Standard Deviation (Population) | 9.3% | 6.8% |
Similar Demographics by Male Poverty
Demographics Similar to Guamanians/Chamorros by Male Poverty
In terms of male poverty, the demographic groups most similar to Guamanians/Chamorros are Venezuelan (11.0%, a difference of 0.020%), Immigrants from Nepal (11.0%, a difference of 0.030%), Immigrants from Venezuela (11.0%, a difference of 0.040%), Armenian (11.0%, a difference of 0.050%), and Icelander (11.0%, a difference of 0.11%).
| Demographics | Rating | Rank | Male Poverty |
| Afghans | 71.9 /100 | #143 | Good 10.9% |
| Samoans | 71.8 /100 | #144 | Good 10.9% |
| Immigrants | Germany | 71.6 /100 | #145 | Good 10.9% |
| Syrians | 71.4 /100 | #146 | Good 10.9% |
| Icelanders | 68.5 /100 | #147 | Good 11.0% |
| Armenians | 68.0 /100 | #148 | Good 11.0% |
| Immigrants | Venezuela | 67.9 /100 | #149 | Good 11.0% |
| Guamanians/Chamorros | 67.6 /100 | #150 | Good 11.0% |
| Venezuelans | 67.4 /100 | #151 | Good 11.0% |
| Immigrants | Nepal | 67.3 /100 | #152 | Good 11.0% |
| Immigrants | Bosnia and Herzegovina | 65.2 /100 | #153 | Good 11.0% |
| Immigrants | Kazakhstan | 64.8 /100 | #154 | Good 11.0% |
| Immigrants | Malaysia | 64.7 /100 | #155 | Good 11.0% |
| Costa Ricans | 63.9 /100 | #156 | Good 11.0% |
| Scotch-Irish | 63.7 /100 | #157 | Good 11.0% |
Demographics Similar to Immigrants from Liberia by Male Poverty
In terms of male poverty, the demographic groups most similar to Immigrants from Liberia are Mexican American Indian (13.0%, a difference of 0.090%), Immigrants from Burma/Myanmar (13.0%, a difference of 0.20%), Immigrants from Ghana (12.9%, a difference of 0.47%), Immigrants from Trinidad and Tobago (13.1%, a difference of 0.47%), and Immigrants from Ecuador (12.9%, a difference of 0.53%).
| Demographics | Rating | Rank | Male Poverty |
| Immigrants | Sudan | 0.2 /100 | #248 | Tragic 12.9% |
| Potawatomi | 0.2 /100 | #249 | Tragic 12.9% |
| Immigrants | Nicaragua | 0.2 /100 | #250 | Tragic 12.9% |
| Immigrants | Cuba | 0.2 /100 | #251 | Tragic 12.9% |
| Immigrants | Ecuador | 0.2 /100 | #252 | Tragic 12.9% |
| Immigrants | Ghana | 0.2 /100 | #253 | Tragic 12.9% |
| Mexican American Indians | 0.1 /100 | #254 | Tragic 13.0% |
| Immigrants | Liberia | 0.1 /100 | #255 | Tragic 13.0% |
| Immigrants | Burma/Myanmar | 0.1 /100 | #256 | Tragic 13.0% |
| Immigrants | Trinidad and Tobago | 0.1 /100 | #257 | Tragic 13.1% |
| Cape Verdeans | 0.1 /100 | #258 | Tragic 13.1% |
| Cherokee | 0.1 /100 | #259 | Tragic 13.1% |
| Ottawa | 0.1 /100 | #260 | Tragic 13.1% |
| Trinidadians and Tobagonians | 0.1 /100 | #261 | Tragic 13.1% |
| Spanish American Indians | 0.1 /100 | #262 | Tragic 13.1% |