Guamanian/Chamorro vs Immigrants from Haiti Births to Unmarried Women
COMPARE
Guamanian/Chamorro
Immigrants from Haiti
Births to Unmarried Women
Births to Unmarried Women Comparison
Guamanians/Chamorros
Immigrants from Haiti
31.6%
BIRTHS TO UNMARRIED WOMEN
51.3/ 100
METRIC RATING
170th/ 347
METRIC RANK
38.9%
BIRTHS TO UNMARRIED WOMEN
0.0/ 100
METRIC RATING
305th/ 347
METRIC RANK
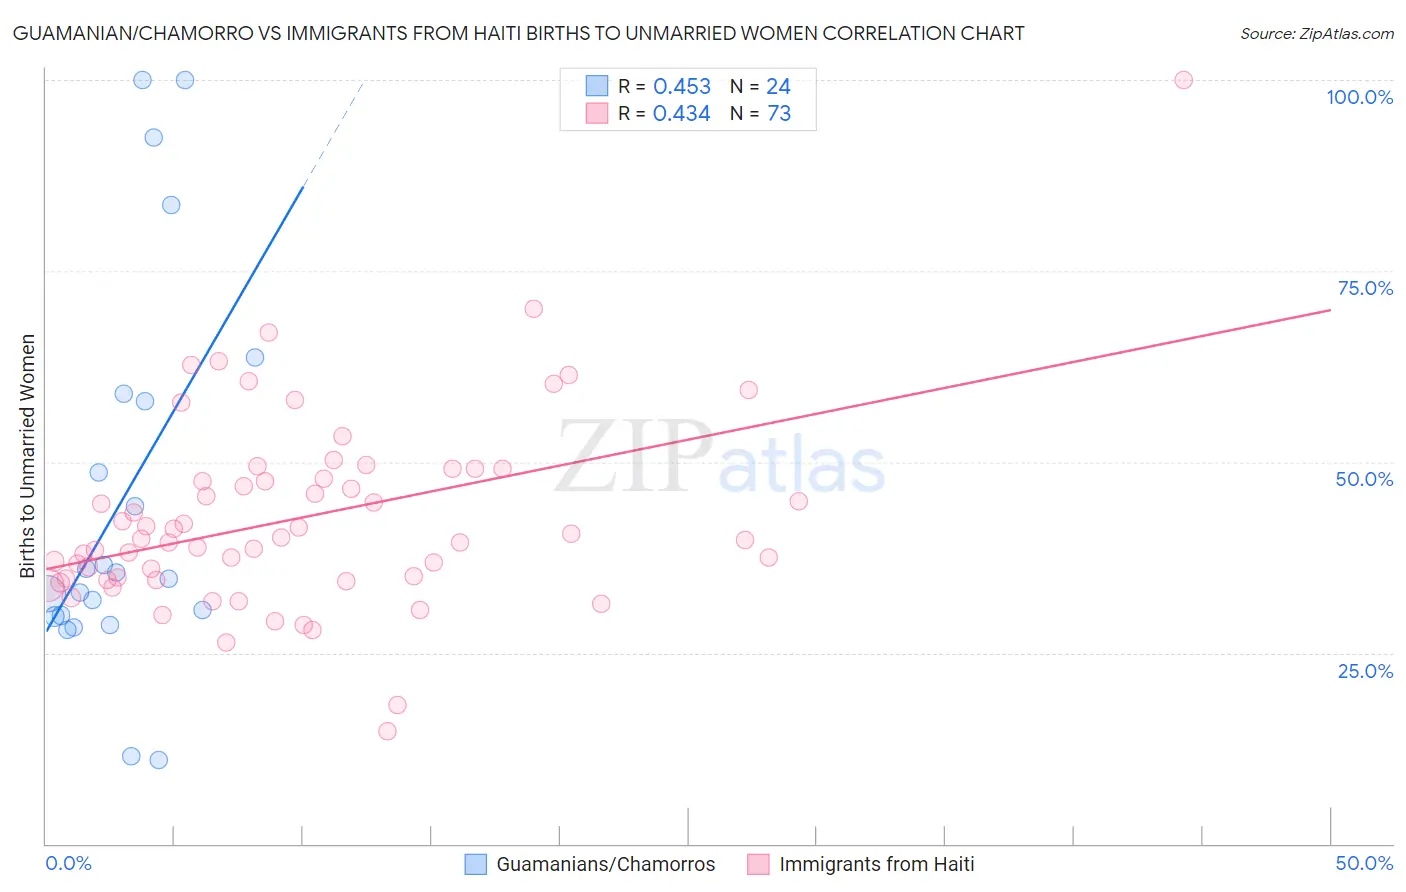
Guamanian/Chamorro vs Immigrants from Haiti Births to Unmarried Women Correlation Chart
The statistical analysis conducted on geographies consisting of 213,790,025 people shows a moderate positive correlation between the proportion of Guamanians/Chamorros and percentage of births to unmarried women in the United States with a correlation coefficient (R) of 0.453 and weighted average of 31.6%. Similarly, the statistical analysis conducted on geographies consisting of 215,750,595 people shows a moderate positive correlation between the proportion of Immigrants from Haiti and percentage of births to unmarried women in the United States with a correlation coefficient (R) of 0.434 and weighted average of 38.9%, a difference of 22.8%.
Births to Unmarried Women Correlation Summary
| Measurement | Guamanian/Chamorro | Immigrants from Haiti |
| Minimum | 10.9% | 14.8% |
| Maximum | 100.0% | 100.0% |
| Range | 89.1% | 85.2% |
| Mean | 45.3% | 42.7% |
| Median | 35.1% | 39.9% |
| Interquartile 25% (IQ1) | 29.8% | 34.7% |
| Interquartile 75% (IQ3) | 58.4% | 48.5% |
| Interquartile Range (IQR) | 28.6% | 13.8% |
| Standard Deviation (Sample) | 25.6% | 12.8% |
| Standard Deviation (Population) | 25.1% | 12.7% |
Similar Demographics by Births to Unmarried Women
Demographics Similar to Guamanians/Chamorros by Births to Unmarried Women
In terms of births to unmarried women, the demographic groups most similar to Guamanians/Chamorros are Slavic (31.6%, a difference of 0.070%), Finnish (31.7%, a difference of 0.080%), Immigrants from Eritrea (31.7%, a difference of 0.090%), Belgian (31.6%, a difference of 0.10%), and Immigrants from Yemen (31.7%, a difference of 0.10%).
| Demographics | Rating | Rank | Births to Unmarried Women |
| Immigrants | Chile | 65.7 /100 | #163 | Good 31.2% |
| Hungarians | 64.1 /100 | #164 | Good 31.2% |
| Immigrants | Somalia | 58.1 /100 | #165 | Average 31.4% |
| Peruvians | 55.5 /100 | #166 | Average 31.5% |
| Dutch | 55.3 /100 | #167 | Average 31.5% |
| Belgians | 52.4 /100 | #168 | Average 31.6% |
| Slavs | 52.0 /100 | #169 | Average 31.6% |
| Guamanians/Chamorros | 51.3 /100 | #170 | Average 31.6% |
| Finns | 50.5 /100 | #171 | Average 31.7% |
| Immigrants | Eritrea | 50.4 /100 | #172 | Average 31.7% |
| Immigrants | Yemen | 50.2 /100 | #173 | Average 31.7% |
| Venezuelans | 50.0 /100 | #174 | Average 31.7% |
| Immigrants | Venezuela | 49.2 /100 | #175 | Average 31.7% |
| Scottish | 48.1 /100 | #176 | Average 31.7% |
| South American Indians | 47.7 /100 | #177 | Average 31.7% |
Demographics Similar to Immigrants from Haiti by Births to Unmarried Women
In terms of births to unmarried women, the demographic groups most similar to Immigrants from Haiti are Yaqui (38.8%, a difference of 0.10%), Immigrants from Jamaica (38.8%, a difference of 0.15%), Central American Indian (39.0%, a difference of 0.29%), Honduran (38.7%, a difference of 0.47%), and Haitian (38.6%, a difference of 0.71%).
| Demographics | Rating | Rank | Births to Unmarried Women |
| Jamaicans | 0.0 /100 | #298 | Tragic 38.5% |
| Spanish Americans | 0.0 /100 | #299 | Tragic 38.6% |
| Immigrants | West Indies | 0.0 /100 | #300 | Tragic 38.6% |
| Haitians | 0.0 /100 | #301 | Tragic 38.6% |
| Hondurans | 0.0 /100 | #302 | Tragic 38.7% |
| Immigrants | Jamaica | 0.0 /100 | #303 | Tragic 38.8% |
| Yaqui | 0.0 /100 | #304 | Tragic 38.8% |
| Immigrants | Haiti | 0.0 /100 | #305 | Tragic 38.9% |
| Central American Indians | 0.0 /100 | #306 | Tragic 39.0% |
| Immigrants | Honduras | 0.0 /100 | #307 | Tragic 39.3% |
| Aleuts | 0.0 /100 | #308 | Tragic 39.3% |
| Cubans | 0.0 /100 | #309 | Tragic 39.4% |
| Immigrants | Dominica | 0.0 /100 | #310 | Tragic 39.5% |
| Immigrants | Azores | 0.0 /100 | #311 | Tragic 39.6% |
| U.S. Virgin Islanders | 0.0 /100 | #312 | Tragic 39.6% |