Guamanian/Chamorro vs Chippewa Single Mother Poverty
COMPARE
Guamanian/Chamorro
Chippewa
Single Mother Poverty
Single Mother Poverty Comparison
Guamanians/Chamorros
Chippewa
29.4%
SINGLE MOTHER POVERTY
31.8/ 100
METRIC RATING
188th/ 347
METRIC RANK
34.8%
SINGLE MOTHER POVERTY
0.0/ 100
METRIC RATING
319th/ 347
METRIC RANK
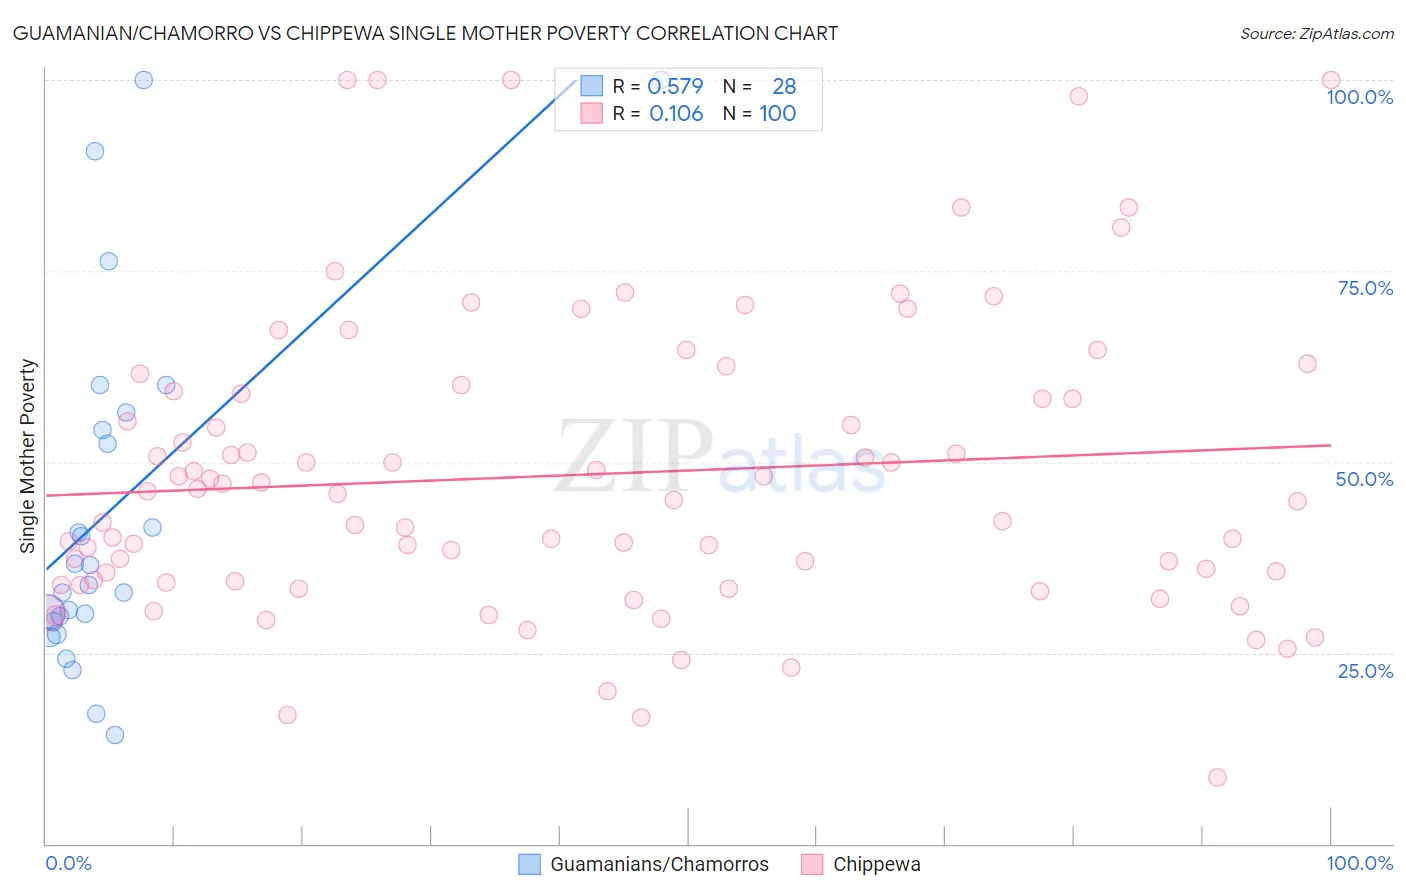
Guamanian/Chamorro vs Chippewa Single Mother Poverty Correlation Chart
The statistical analysis conducted on geographies consisting of 219,675,506 people shows a substantial positive correlation between the proportion of Guamanians/Chamorros and poverty level among single mothers in the United States with a correlation coefficient (R) of 0.579 and weighted average of 29.4%. Similarly, the statistical analysis conducted on geographies consisting of 212,048,110 people shows a poor positive correlation between the proportion of Chippewa and poverty level among single mothers in the United States with a correlation coefficient (R) of 0.106 and weighted average of 34.8%, a difference of 18.1%.
Single Mother Poverty Correlation Summary
| Measurement | Guamanian/Chamorro | Chippewa |
| Minimum | 14.3% | 8.7% |
| Maximum | 100.0% | 100.0% |
| Range | 85.7% | 91.3% |
| Mean | 43.9% | 48.3% |
| Median | 35.2% | 45.4% |
| Interquartile 25% (IQ1) | 29.4% | 34.3% |
| Interquartile 75% (IQ3) | 55.3% | 59.1% |
| Interquartile Range (IQR) | 25.8% | 24.8% |
| Standard Deviation (Sample) | 23.4% | 19.5% |
| Standard Deviation (Population) | 23.0% | 19.4% |
Similar Demographics by Single Mother Poverty
Demographics Similar to Guamanians/Chamorros by Single Mother Poverty
In terms of single mother poverty, the demographic groups most similar to Guamanians/Chamorros are Immigrants from Africa (29.4%, a difference of 0.010%), Lebanese (29.4%, a difference of 0.040%), Immigrants from Germany (29.5%, a difference of 0.070%), Immigrants from Trinidad and Tobago (29.5%, a difference of 0.14%), and Moroccan (29.5%, a difference of 0.18%).
| Demographics | Rating | Rank | Single Mother Poverty |
| Canadians | 40.4 /100 | #181 | Average 29.3% |
| Immigrants | Eastern Africa | 38.5 /100 | #182 | Fair 29.3% |
| Nepalese | 38.3 /100 | #183 | Fair 29.3% |
| Nigerians | 38.0 /100 | #184 | Fair 29.3% |
| Ghanaians | 36.8 /100 | #185 | Fair 29.4% |
| Yugoslavians | 36.0 /100 | #186 | Fair 29.4% |
| Lebanese | 32.5 /100 | #187 | Fair 29.4% |
| Guamanians/Chamorros | 31.8 /100 | #188 | Fair 29.4% |
| Immigrants | Africa | 31.6 /100 | #189 | Fair 29.4% |
| Immigrants | Germany | 30.4 /100 | #190 | Fair 29.5% |
| Immigrants | Trinidad and Tobago | 29.2 /100 | #191 | Fair 29.5% |
| Moroccans | 28.6 /100 | #192 | Fair 29.5% |
| Basques | 28.3 /100 | #193 | Fair 29.5% |
| Icelanders | 26.1 /100 | #194 | Fair 29.5% |
| Slavs | 24.5 /100 | #195 | Fair 29.6% |
Demographics Similar to Chippewa by Single Mother Poverty
In terms of single mother poverty, the demographic groups most similar to Chippewa are Immigrants from Honduras (34.7%, a difference of 0.15%), Iroquois (34.8%, a difference of 0.24%), Cherokee (34.5%, a difference of 0.67%), Dominican (34.5%, a difference of 0.78%), and Hopi (34.5%, a difference of 0.90%).
| Demographics | Rating | Rank | Single Mother Poverty |
| Central American Indians | 0.0 /100 | #312 | Tragic 34.3% |
| Immigrants | Dominican Republic | 0.0 /100 | #313 | Tragic 34.4% |
| Chickasaw | 0.0 /100 | #314 | Tragic 34.4% |
| Hopi | 0.0 /100 | #315 | Tragic 34.5% |
| Dominicans | 0.0 /100 | #316 | Tragic 34.5% |
| Cherokee | 0.0 /100 | #317 | Tragic 34.5% |
| Immigrants | Honduras | 0.0 /100 | #318 | Tragic 34.7% |
| Chippewa | 0.0 /100 | #319 | Tragic 34.8% |
| Iroquois | 0.0 /100 | #320 | Tragic 34.8% |
| Paiute | 0.0 /100 | #321 | Tragic 35.1% |
| Blacks/African Americans | 0.0 /100 | #322 | Tragic 35.2% |
| Kiowa | 0.0 /100 | #323 | Tragic 35.5% |
| Ottawa | 0.0 /100 | #324 | Tragic 35.5% |
| Ute | 0.0 /100 | #325 | Tragic 35.7% |
| Seminole | 0.0 /100 | #326 | Tragic 35.8% |