Guamanian/Chamorro vs Lithuanian Births to Unmarried Women
COMPARE
Guamanian/Chamorro
Lithuanian
Births to Unmarried Women
Births to Unmarried Women Comparison
Guamanians/Chamorros
Lithuanians
31.6%
BIRTHS TO UNMARRIED WOMEN
51.3/ 100
METRIC RATING
170th/ 347
METRIC RANK
29.6%
BIRTHS TO UNMARRIED WOMEN
94.4/ 100
METRIC RATING
104th/ 347
METRIC RANK
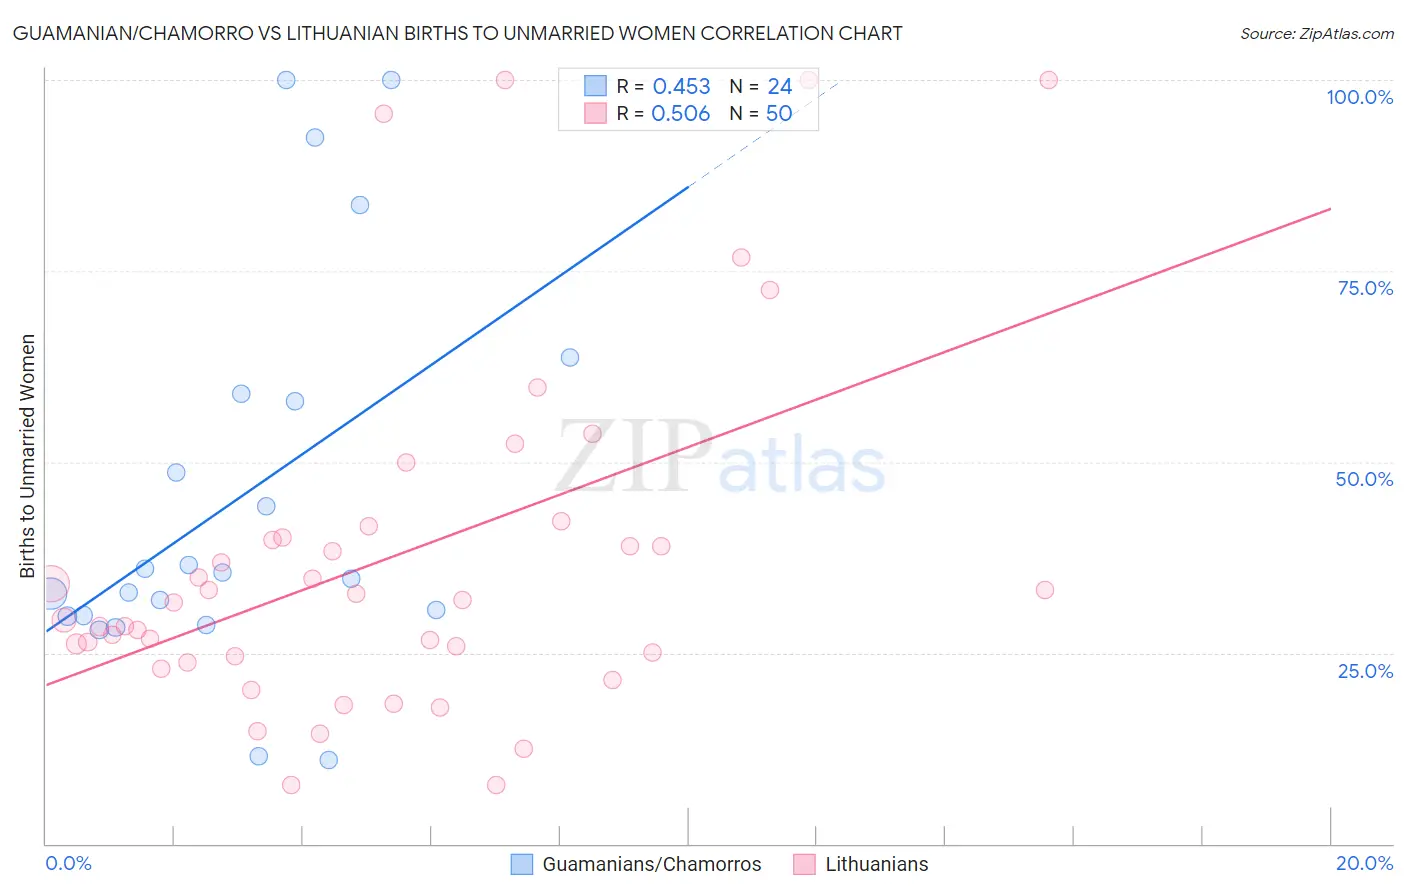
Guamanian/Chamorro vs Lithuanian Births to Unmarried Women Correlation Chart
The statistical analysis conducted on geographies consisting of 213,790,025 people shows a moderate positive correlation between the proportion of Guamanians/Chamorros and percentage of births to unmarried women in the United States with a correlation coefficient (R) of 0.453 and weighted average of 31.6%. Similarly, the statistical analysis conducted on geographies consisting of 385,212,926 people shows a substantial positive correlation between the proportion of Lithuanians and percentage of births to unmarried women in the United States with a correlation coefficient (R) of 0.506 and weighted average of 29.6%, a difference of 7.0%.
Births to Unmarried Women Correlation Summary
| Measurement | Guamanian/Chamorro | Lithuanian |
| Minimum | 10.9% | 7.7% |
| Maximum | 100.0% | 100.0% |
| Range | 89.1% | 92.3% |
| Mean | 45.3% | 37.3% |
| Median | 35.1% | 31.8% |
| Interquartile 25% (IQ1) | 29.8% | 24.6% |
| Interquartile 75% (IQ3) | 58.4% | 40.0% |
| Interquartile Range (IQR) | 28.6% | 15.4% |
| Standard Deviation (Sample) | 25.6% | 23.1% |
| Standard Deviation (Population) | 25.1% | 22.9% |
Similar Demographics by Births to Unmarried Women
Demographics Similar to Guamanians/Chamorros by Births to Unmarried Women
In terms of births to unmarried women, the demographic groups most similar to Guamanians/Chamorros are Slavic (31.6%, a difference of 0.070%), Finnish (31.7%, a difference of 0.080%), Immigrants from Eritrea (31.7%, a difference of 0.090%), Belgian (31.6%, a difference of 0.10%), and Immigrants from Yemen (31.7%, a difference of 0.10%).
| Demographics | Rating | Rank | Births to Unmarried Women |
| Immigrants | Chile | 65.7 /100 | #163 | Good 31.2% |
| Hungarians | 64.1 /100 | #164 | Good 31.2% |
| Immigrants | Somalia | 58.1 /100 | #165 | Average 31.4% |
| Peruvians | 55.5 /100 | #166 | Average 31.5% |
| Dutch | 55.3 /100 | #167 | Average 31.5% |
| Belgians | 52.4 /100 | #168 | Average 31.6% |
| Slavs | 52.0 /100 | #169 | Average 31.6% |
| Guamanians/Chamorros | 51.3 /100 | #170 | Average 31.6% |
| Finns | 50.5 /100 | #171 | Average 31.7% |
| Immigrants | Eritrea | 50.4 /100 | #172 | Average 31.7% |
| Immigrants | Yemen | 50.2 /100 | #173 | Average 31.7% |
| Venezuelans | 50.0 /100 | #174 | Average 31.7% |
| Immigrants | Venezuela | 49.2 /100 | #175 | Average 31.7% |
| Scottish | 48.1 /100 | #176 | Average 31.7% |
| South American Indians | 47.7 /100 | #177 | Average 31.7% |
Demographics Similar to Lithuanians by Births to Unmarried Women
In terms of births to unmarried women, the demographic groups most similar to Lithuanians are Lebanese (29.5%, a difference of 0.010%), Immigrants from Nepal (29.6%, a difference of 0.050%), Australian (29.5%, a difference of 0.060%), Immigrants from Northern Africa (29.5%, a difference of 0.14%), and Swedish (29.6%, a difference of 0.30%).
| Demographics | Rating | Rank | Births to Unmarried Women |
| Immigrants | South Africa | 95.7 /100 | #97 | Exceptional 29.3% |
| Immigrants | Syria | 95.7 /100 | #98 | Exceptional 29.4% |
| Immigrants | Denmark | 95.3 /100 | #99 | Exceptional 29.4% |
| Luxembourgers | 95.2 /100 | #100 | Exceptional 29.4% |
| Immigrants | Northern Africa | 94.7 /100 | #101 | Exceptional 29.5% |
| Australians | 94.6 /100 | #102 | Exceptional 29.5% |
| Lebanese | 94.4 /100 | #103 | Exceptional 29.5% |
| Lithuanians | 94.4 /100 | #104 | Exceptional 29.6% |
| Immigrants | Nepal | 94.3 /100 | #105 | Exceptional 29.6% |
| Swedes | 93.8 /100 | #106 | Exceptional 29.6% |
| Immigrants | Brazil | 93.7 /100 | #107 | Exceptional 29.6% |
| Paraguayans | 93.5 /100 | #108 | Exceptional 29.7% |
| Greeks | 93.4 /100 | #109 | Exceptional 29.7% |
| Immigrants | Ethiopia | 93.4 /100 | #110 | Exceptional 29.7% |
| Immigrants | Hungary | 93.0 /100 | #111 | Exceptional 29.7% |