Guamanian/Chamorro vs Immigrants from Eritrea Births to Unmarried Women
COMPARE
Guamanian/Chamorro
Immigrants from Eritrea
Births to Unmarried Women
Births to Unmarried Women Comparison
Guamanians/Chamorros
Immigrants from Eritrea
31.6%
BIRTHS TO UNMARRIED WOMEN
51.3/ 100
METRIC RATING
170th/ 347
METRIC RANK
31.7%
BIRTHS TO UNMARRIED WOMEN
50.4/ 100
METRIC RATING
172nd/ 347
METRIC RANK
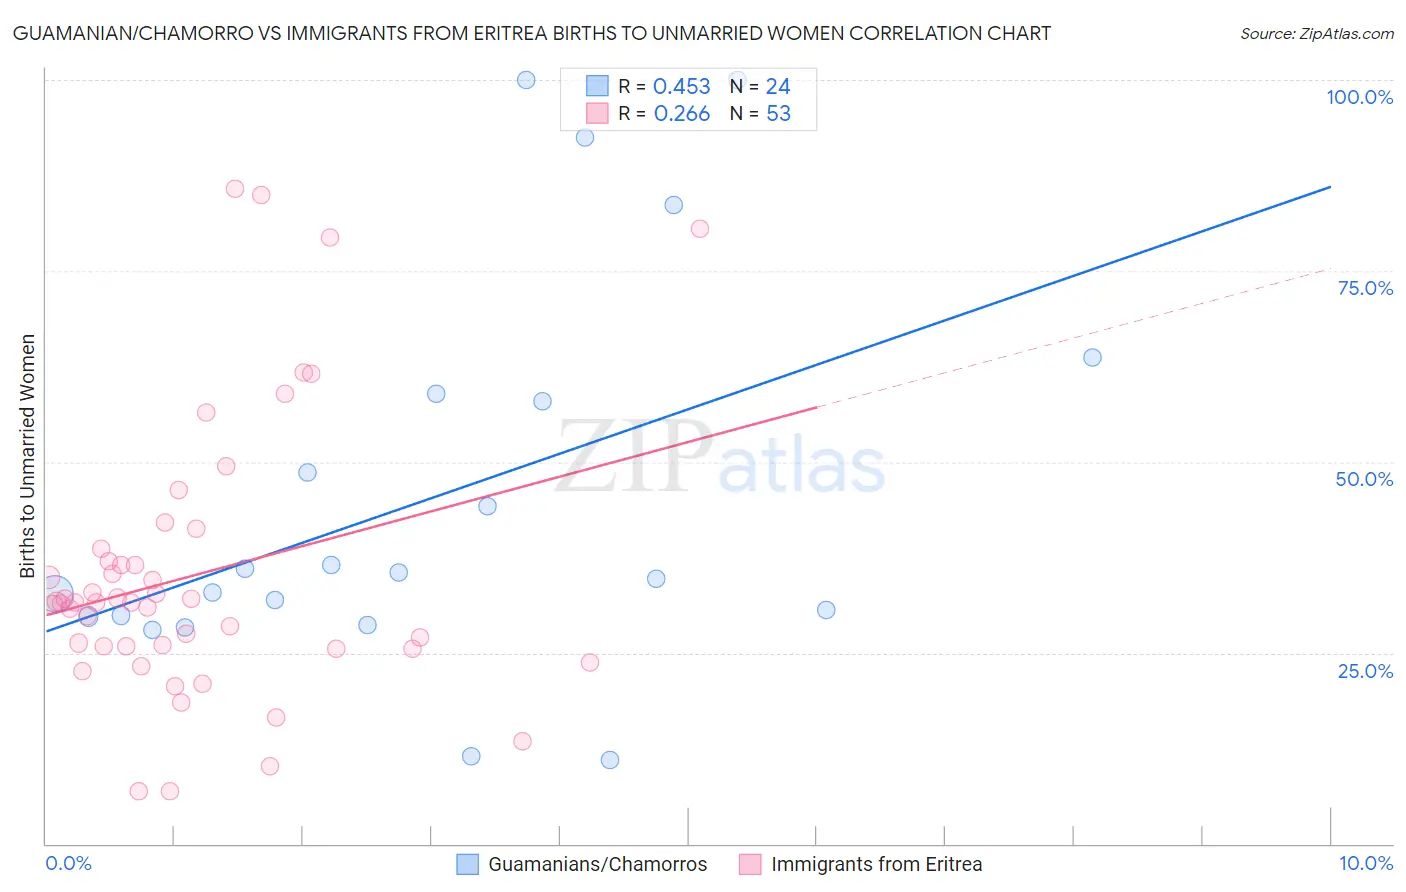
Guamanian/Chamorro vs Immigrants from Eritrea Births to Unmarried Women Correlation Chart
The statistical analysis conducted on geographies consisting of 213,790,025 people shows a moderate positive correlation between the proportion of Guamanians/Chamorros and percentage of births to unmarried women in the United States with a correlation coefficient (R) of 0.453 and weighted average of 31.6%. Similarly, the statistical analysis conducted on geographies consisting of 103,370,880 people shows a weak positive correlation between the proportion of Immigrants from Eritrea and percentage of births to unmarried women in the United States with a correlation coefficient (R) of 0.266 and weighted average of 31.7%, a difference of 0.090%.
Births to Unmarried Women Correlation Summary
| Measurement | Guamanian/Chamorro | Immigrants from Eritrea |
| Minimum | 10.9% | 6.8% |
| Maximum | 100.0% | 85.7% |
| Range | 89.1% | 78.9% |
| Mean | 45.3% | 35.2% |
| Median | 35.1% | 31.6% |
| Interquartile 25% (IQ1) | 29.8% | 25.8% |
| Interquartile 75% (IQ3) | 58.4% | 37.8% |
| Interquartile Range (IQR) | 28.6% | 12.0% |
| Standard Deviation (Sample) | 25.6% | 18.1% |
| Standard Deviation (Population) | 25.1% | 17.9% |
Demographics Similar to Guamanians/Chamorros and Immigrants from Eritrea by Births to Unmarried Women
In terms of births to unmarried women, the demographic groups most similar to Guamanians/Chamorros are Slavic (31.6%, a difference of 0.070%), Finnish (31.7%, a difference of 0.080%), Belgian (31.6%, a difference of 0.10%), Immigrants from Yemen (31.7%, a difference of 0.10%), and Venezuelan (31.7%, a difference of 0.13%). Similarly, the demographic groups most similar to Immigrants from Eritrea are Finnish (31.7%, a difference of 0.010%), Immigrants from Yemen (31.7%, a difference of 0.020%), Venezuelan (31.7%, a difference of 0.040%), Immigrants from Venezuela (31.7%, a difference of 0.12%), and Slavic (31.6%, a difference of 0.15%).
| Demographics | Rating | Rank | Births to Unmarried Women |
| Immigrants | Southern Europe | 68.7 /100 | #161 | Good 31.1% |
| Slovenes | 65.9 /100 | #162 | Good 31.2% |
| Immigrants | Chile | 65.7 /100 | #163 | Good 31.2% |
| Hungarians | 64.1 /100 | #164 | Good 31.2% |
| Immigrants | Somalia | 58.1 /100 | #165 | Average 31.4% |
| Peruvians | 55.5 /100 | #166 | Average 31.5% |
| Dutch | 55.3 /100 | #167 | Average 31.5% |
| Belgians | 52.4 /100 | #168 | Average 31.6% |
| Slavs | 52.0 /100 | #169 | Average 31.6% |
| Guamanians/Chamorros | 51.3 /100 | #170 | Average 31.6% |
| Finns | 50.5 /100 | #171 | Average 31.7% |
| Immigrants | Eritrea | 50.4 /100 | #172 | Average 31.7% |
| Immigrants | Yemen | 50.2 /100 | #173 | Average 31.7% |
| Venezuelans | 50.0 /100 | #174 | Average 31.7% |
| Immigrants | Venezuela | 49.2 /100 | #175 | Average 31.7% |
| Scottish | 48.1 /100 | #176 | Average 31.7% |
| South American Indians | 47.7 /100 | #177 | Average 31.7% |
| English | 47.4 /100 | #178 | Average 31.7% |
| South Americans | 46.9 /100 | #179 | Average 31.8% |
| Moroccans | 45.7 /100 | #180 | Average 31.8% |
| Immigrants | Peru | 45.1 /100 | #181 | Average 31.8% |