Immigrants vs Kiowa Average Family Size
COMPARE
Immigrants
Kiowa
Average Family Size
Average Family Size Comparison
Immigrants
Kiowa
3.33
AVERAGE FAMILY SIZE
99.9/ 100
METRIC RATING
69th/ 347
METRIC RANK
3.27
AVERAGE FAMILY SIZE
94.8/ 100
METRIC RATING
117th/ 347
METRIC RANK
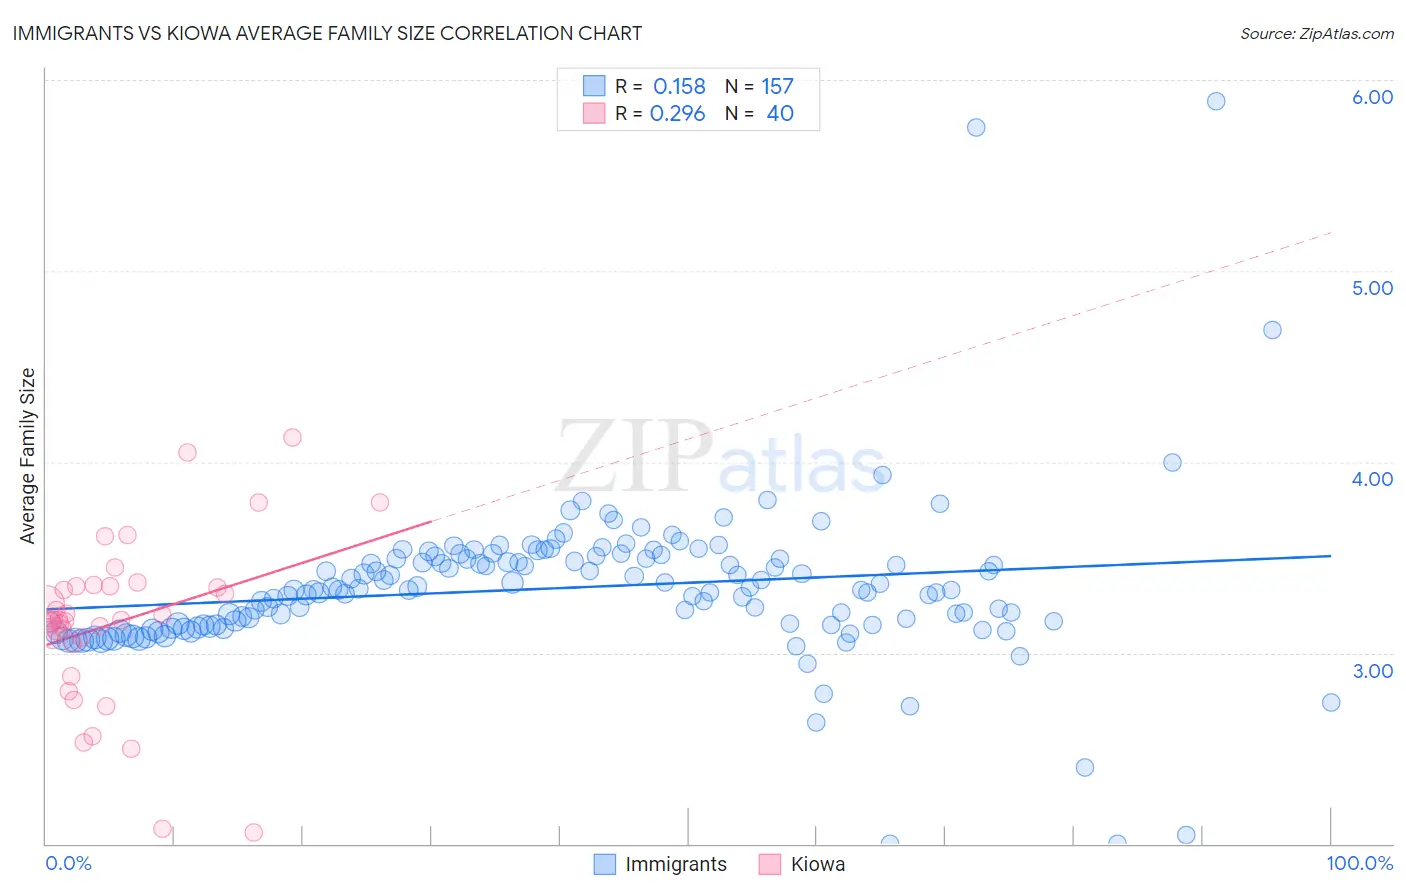
Immigrants vs Kiowa Average Family Size Correlation Chart
The statistical analysis conducted on geographies consisting of 577,097,372 people shows a poor positive correlation between the proportion of Immigrants and average family size in the United States with a correlation coefficient (R) of 0.158 and weighted average of 3.33. Similarly, the statistical analysis conducted on geographies consisting of 56,098,854 people shows a weak positive correlation between the proportion of Kiowa and average family size in the United States with a correlation coefficient (R) of 0.296 and weighted average of 3.27, a difference of 1.8%.
Average Family Size Correlation Summary
| Measurement | Immigrants | Kiowa |
| Minimum | 2.00 | 2.06 |
| Maximum | 5.89 | 4.13 |
| Range | 3.89 | 2.07 |
| Mean | 3.34 | 3.16 |
| Median | 3.33 | 3.17 |
| Interquartile 25% (IQ1) | 3.14 | 3.06 |
| Interquartile 75% (IQ3) | 3.49 | 3.35 |
| Interquartile Range (IQR) | 0.35 | 0.29 |
| Standard Deviation (Sample) | 0.42 | 0.44 |
| Standard Deviation (Population) | 0.42 | 0.43 |
Similar Demographics by Average Family Size
Demographics Similar to Immigrants by Average Family Size
In terms of average family size, the demographic groups most similar to Immigrants are Immigrants from Cambodia (3.33, a difference of 0.030%), Immigrants from Trinidad and Tobago (3.33, a difference of 0.050%), Immigrants from West Indies (3.33, a difference of 0.060%), Immigrants from Jamaica (3.33, a difference of 0.11%), and Immigrants from Caribbean (3.33, a difference of 0.13%).
| Demographics | Rating | Rank | Average Family Size |
| Immigrants | Grenada | 100.0 /100 | #62 | Exceptional 3.34 |
| Chinese | 100.0 /100 | #63 | Exceptional 3.34 |
| Dominicans | 99.9 /100 | #64 | Exceptional 3.34 |
| Immigrants | Laos | 99.9 /100 | #65 | Exceptional 3.34 |
| Immigrants | St. Vincent and the Grenadines | 99.9 /100 | #66 | Exceptional 3.34 |
| Immigrants | Jamaica | 99.9 /100 | #67 | Exceptional 3.33 |
| Immigrants | Cambodia | 99.9 /100 | #68 | Exceptional 3.33 |
| Immigrants | Immigrants | 99.9 /100 | #69 | Exceptional 3.33 |
| Immigrants | Trinidad and Tobago | 99.9 /100 | #70 | Exceptional 3.33 |
| Immigrants | West Indies | 99.9 /100 | #71 | Exceptional 3.33 |
| Immigrants | Caribbean | 99.9 /100 | #72 | Exceptional 3.33 |
| Yaqui | 99.9 /100 | #73 | Exceptional 3.32 |
| Immigrants | Sierra Leone | 99.9 /100 | #74 | Exceptional 3.32 |
| Immigrants | Barbados | 99.8 /100 | #75 | Exceptional 3.32 |
| Trinidadians and Tobagonians | 99.8 /100 | #76 | Exceptional 3.32 |
Demographics Similar to Kiowa by Average Family Size
In terms of average family size, the demographic groups most similar to Kiowa are Immigrants from Liberia (3.27, a difference of 0.020%), Immigrants from South America (3.27, a difference of 0.020%), South American (3.27, a difference of 0.030%), Immigrants from Asia (3.27, a difference of 0.070%), and Immigrants from Panama (3.27, a difference of 0.080%).
| Demographics | Rating | Rank | Average Family Size |
| Bahamians | 96.6 /100 | #110 | Exceptional 3.28 |
| Indonesians | 96.2 /100 | #111 | Exceptional 3.28 |
| Blacks/African Americans | 95.7 /100 | #112 | Exceptional 3.27 |
| Immigrants | Panama | 95.6 /100 | #113 | Exceptional 3.27 |
| South Americans | 95.1 /100 | #114 | Exceptional 3.27 |
| Immigrants | Liberia | 95.0 /100 | #115 | Exceptional 3.27 |
| Immigrants | South America | 95.0 /100 | #116 | Exceptional 3.27 |
| Kiowa | 94.8 /100 | #117 | Exceptional 3.27 |
| Immigrants | Asia | 94.0 /100 | #118 | Exceptional 3.27 |
| Immigrants | Indonesia | 93.7 /100 | #119 | Exceptional 3.27 |
| Immigrants | Bahamas | 93.6 /100 | #120 | Exceptional 3.27 |
| Immigrants | Thailand | 93.3 /100 | #121 | Exceptional 3.27 |
| Immigrants | Colombia | 92.8 /100 | #122 | Exceptional 3.27 |
| Alaskan Athabascans | 92.4 /100 | #123 | Exceptional 3.27 |
| South American Indians | 91.6 /100 | #124 | Exceptional 3.26 |