Fijian vs Kiowa In Labor Force | Age 35-44
COMPARE
Fijian
Kiowa
In Labor Force | Age 35-44
In Labor Force | Age 35-44 Comparison
Fijians
Kiowa
82.9%
IN LABOR FORCE | AGE 35-44
0.0/ 100
METRIC RATING
285th/ 347
METRIC RANK
79.2%
IN LABOR FORCE | AGE 35-44
0.0/ 100
METRIC RATING
333rd/ 347
METRIC RANK
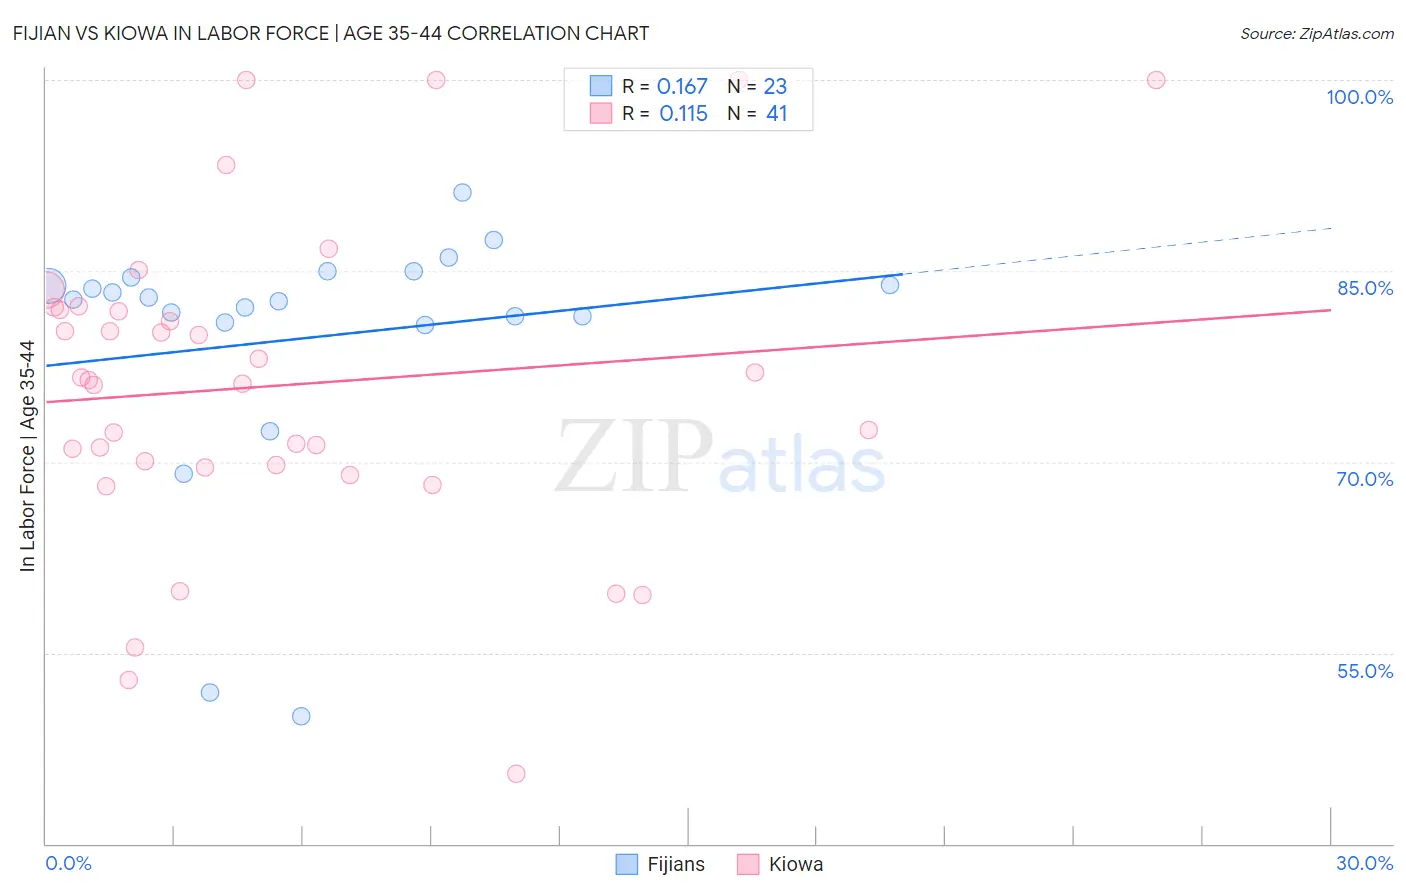
Fijian vs Kiowa In Labor Force | Age 35-44 Correlation Chart
The statistical analysis conducted on geographies consisting of 55,946,572 people shows a poor positive correlation between the proportion of Fijians and labor force participation rate among population between the ages 35 and 44 in the United States with a correlation coefficient (R) of 0.167 and weighted average of 82.9%. Similarly, the statistical analysis conducted on geographies consisting of 56,099,396 people shows a poor positive correlation between the proportion of Kiowa and labor force participation rate among population between the ages 35 and 44 in the United States with a correlation coefficient (R) of 0.115 and weighted average of 79.2%, a difference of 4.7%.
In Labor Force | Age 35-44 Correlation Summary
| Measurement | Fijian | Kiowa |
| Minimum | 50.0% | 45.5% |
| Maximum | 91.2% | 100.0% |
| Range | 41.2% | 54.5% |
| Mean | 79.7% | 76.0% |
| Median | 82.8% | 76.4% |
| Interquartile 25% (IQ1) | 80.9% | 69.7% |
| Interquartile 75% (IQ3) | 84.5% | 82.0% |
| Interquartile Range (IQR) | 3.5% | 12.4% |
| Standard Deviation (Sample) | 10.1% | 12.5% |
| Standard Deviation (Population) | 9.9% | 12.3% |
Similar Demographics by In Labor Force | Age 35-44
Demographics Similar to Fijians by In Labor Force | Age 35-44
In terms of in labor force | age 35-44, the demographic groups most similar to Fijians are Immigrants from Bangladesh (82.9%, a difference of 0.0%), Immigrants from Belize (82.9%, a difference of 0.0%), Immigrants from Dominican Republic (82.9%, a difference of 0.010%), Osage (82.9%, a difference of 0.020%), and Immigrants from Guatemala (82.9%, a difference of 0.020%).
| Demographics | Rating | Rank | In Labor Force | Age 35-44 |
| Belizeans | 0.0 /100 | #278 | Tragic 83.1% |
| Immigrants | Micronesia | 0.0 /100 | #279 | Tragic 83.1% |
| Dominicans | 0.0 /100 | #280 | Tragic 83.1% |
| Guatemalans | 0.0 /100 | #281 | Tragic 83.0% |
| Osage | 0.0 /100 | #282 | Tragic 82.9% |
| Immigrants | Guatemala | 0.0 /100 | #283 | Tragic 82.9% |
| Immigrants | Dominican Republic | 0.0 /100 | #284 | Tragic 82.9% |
| Fijians | 0.0 /100 | #285 | Tragic 82.9% |
| Immigrants | Bangladesh | 0.0 /100 | #286 | Tragic 82.9% |
| Immigrants | Belize | 0.0 /100 | #287 | Tragic 82.9% |
| Puget Sound Salish | 0.0 /100 | #288 | Tragic 82.9% |
| Chippewa | 0.0 /100 | #289 | Tragic 82.9% |
| Africans | 0.0 /100 | #290 | Tragic 82.9% |
| Pennsylvania Germans | 0.0 /100 | #291 | Tragic 82.9% |
| Immigrants | Latin America | 0.0 /100 | #292 | Tragic 82.8% |
Demographics Similar to Kiowa by In Labor Force | Age 35-44
In terms of in labor force | age 35-44, the demographic groups most similar to Kiowa are Yakama (79.0%, a difference of 0.29%), Ute (79.4%, a difference of 0.33%), Houma (79.5%, a difference of 0.39%), Native/Alaskan (78.9%, a difference of 0.40%), and Cheyenne (79.5%, a difference of 0.41%).
| Demographics | Rating | Rank | In Labor Force | Age 35-44 |
| Seminole | 0.0 /100 | #326 | Tragic 80.4% |
| Sioux | 0.0 /100 | #327 | Tragic 80.2% |
| Creek | 0.0 /100 | #328 | Tragic 80.0% |
| Menominee | 0.0 /100 | #329 | Tragic 79.7% |
| Cheyenne | 0.0 /100 | #330 | Tragic 79.5% |
| Houma | 0.0 /100 | #331 | Tragic 79.5% |
| Ute | 0.0 /100 | #332 | Tragic 79.4% |
| Kiowa | 0.0 /100 | #333 | Tragic 79.2% |
| Yakama | 0.0 /100 | #334 | Tragic 79.0% |
| Natives/Alaskans | 0.0 /100 | #335 | Tragic 78.9% |
| Arapaho | 0.0 /100 | #336 | Tragic 78.1% |
| Apache | 0.0 /100 | #337 | Tragic 77.9% |
| Pueblo | 0.0 /100 | #338 | Tragic 77.4% |
| Yup'ik | 0.0 /100 | #339 | Tragic 77.3% |
| Lumbee | 0.0 /100 | #340 | Tragic 77.0% |